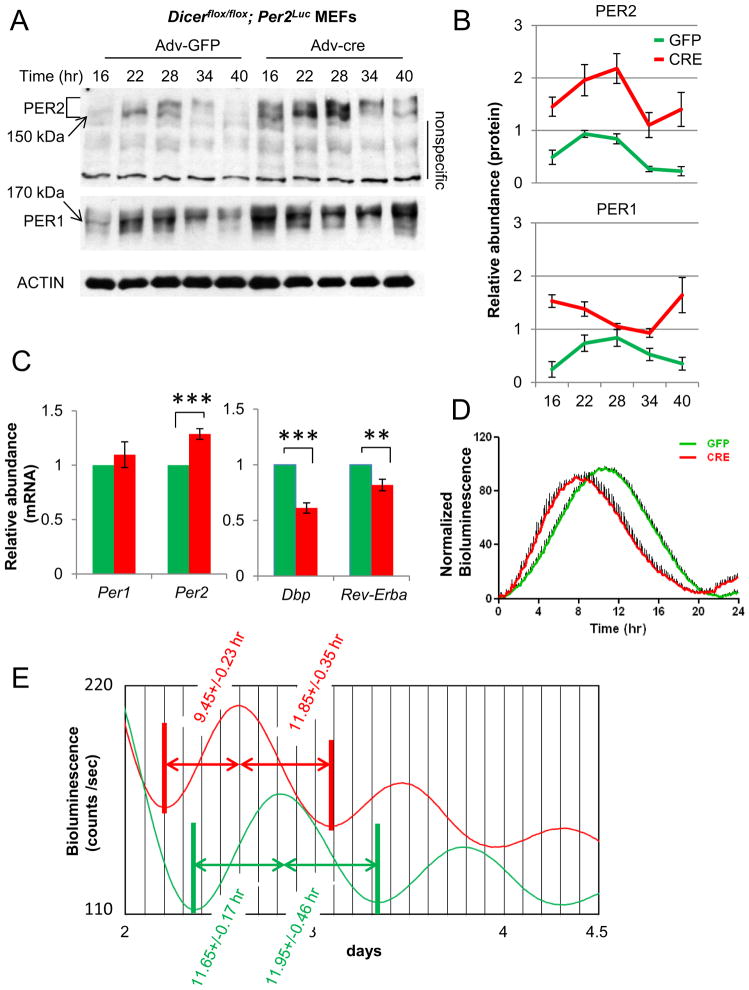
Fig 3.
PER protein levels are elevated and bioluminescence (PER2-LUC) rhythms accumulate faster and peak earlier in Dicer-deficient cells (CRE) compared to Dicer-intact cells (GFP). (A) PER protein levels are higher in Dicer-deficient cells than control cells. The samples were harvested at the indicated times after a 2-hr serum shock. See also Fig S3A. (B) Quantitation is shown as mean+/−SEM of three independent experiments. (C) mRNA levels of Per1 and Per2 are only modestly increased in Dicer-deficient cells, less substantially than their protein levels. mRNA levels of clock-controlled genes Dbp and Rev-erbα are significantly lowered. mRNA levels were measured by quantitative RT-PCR from 6 samples harvested at several times over one circadian cycle. The data are shown as mean+/−SEM. (D) In the circadian rhythm of PER2-LUC expression, the upswing is shortened while the downswing is not affected. Dicerflox/flox;Per2Luc MEFs were treated with 40 ug/ml cycloheximide (CHX) for 10 hrs followed by washoff, and then bioluminescence was measured. We showed that endogenous PER1/2 can be almost completely depleted by CHX treatment for 10 hrs [29]. The peak of bioluminescence was set at 100 in each case, as has been done by Meng et al. and Etchegaray et al. [44, 59]. Note that the ~2-hr period shortening mostly comes from the accumulation (upswing) phase. The results are shown as mean+/−SEM of 10 samples. (E) Similar asymmetrical bioluminescence profiles are observed in Fig 2A. Single representative traces for GFP and Cre-MEFs are shown, but the numbers in mean+/−SEM were calculated from 10 samples each. Note that the period difference resulted from the shortened rising phase of the curves (p<0.01). Times from trough to peak and from peak to trough were calculated using Clocklab software after applying smoothing.

