Figure 1.

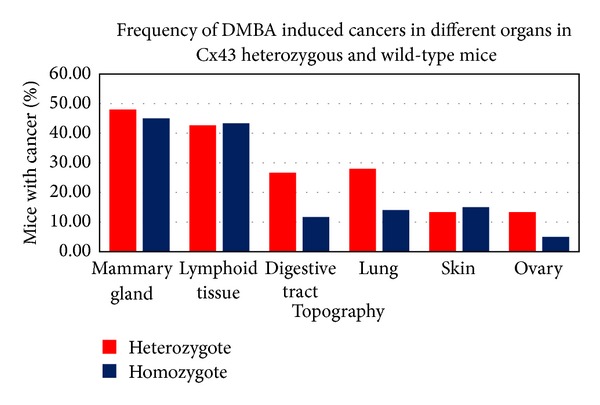
Bar graphic showing the proportional incidence among different topographies compared with the Cx43+/− and Cx43+/+ groups.

Bar graphic showing the proportional incidence among different topographies compared with the Cx43+/− and Cx43+/+ groups.