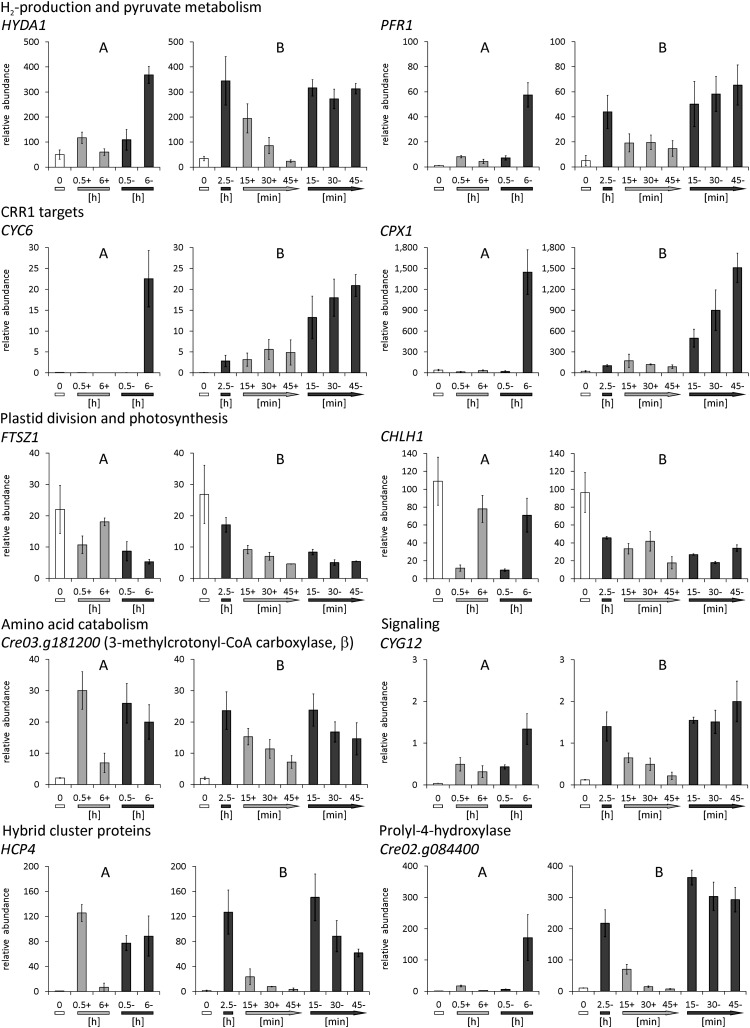
Figure 10.
Effect of O2 on Transcript Abundances Estimated by qRT-PCR.
(A) Cells were incubated aerobically (+; light-gray bars) or anaerobically (–; dark-gray bars) in the dark (see Supplemental Figure 6A online).
(B) Cell suspensions were first incubated for 2.5 h in sealed flasks in the dark (2.5-; dark-gray bar) and then transferred to open beakers in the dark (+; light gray arrows) or kept in sealed flasks (–; dark gray arrows) (see Supplemental Figure 6B online).
In all cases, RNA was isolated also from precultures grown aerated in the light (0; white bars). Relative transcript abundances were calculated relative to the RCK1 transcript (CBLP, Cre13.g599400). Values shown are from biological triplicates, analyzed in technical triplicates. Error bars = sd.

