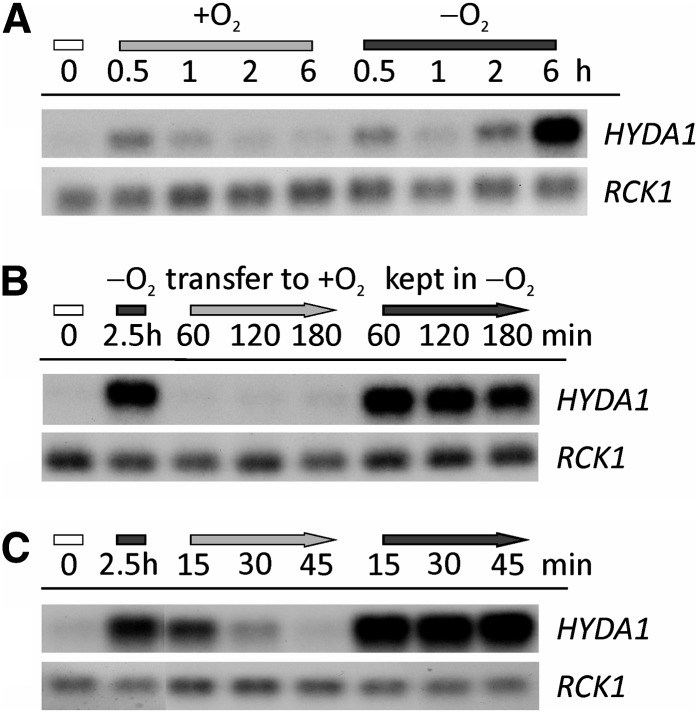
Figure 9.
Impact of O2 on HYDA1 Transcript in the Dark.
(A) Cells were incubated for the indicated time points in open (+O2, light-gray bar) or sealed (−O2, dark-gray bar) flasks in the dark. Cell concentrations at 0 h (white bar) were 2.2 × 10⁶ cells mL−1.
(B) and (C) Light-grown cells (0 h, white bar) were incubated for 2.5 h in sealed flasks in the dark (dark-gray bar) and then transferred to open beakers in the dark (+O2, light-gray arrow) or kept in sealed flasks (−O2, dark-gray arrow) for the indicated time points. Cell numbers of the precultures were 2.7 (B) and 2.2 × 10⁶ cells mL−1 (C).
RNA was isolated at the depicted time points. HYDA1 RNA hybridization was conducted with a HYDA1-specific probe. RCK1 (CBLP, Cre13.g599400) served as the reference transcript. Supplemental Figures 6A and 6B online provide schemes of the experimental setups.

