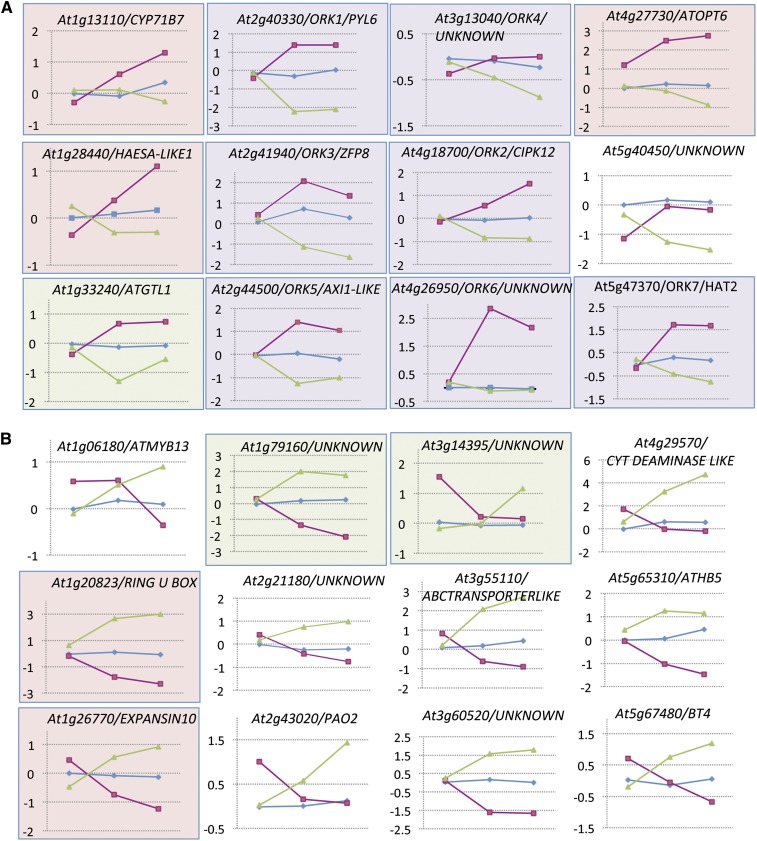
Figure 4.
Microarray Time-Course Data for Genes Oppositely Regulated by REV and KAN1 (ORKs).
(A) ORKs upregulated in GR-REV and downregulated by KAN1-GR.
(B) ORKs downregulated in GR-REV and upregulated by KAN1-GR.
x axis, time points are 0, 30, and 60 min after dexamethasone addition to the medium; y axis, transcript level normalized to mean value of untreated Col transcripts (log base 2). Magenta line represents GR-REV; blue line represents wild-type Col; green line represents KAN1-GR. Genes in pink-shaded boxes retested significant for REV regulation (P < 0.05) by qRT-PCR. Genes in green-shaded boxes retested significant for KAN1 regulation (P < 0.05) by qRT-PCR. Genes in purple shaded boxes retested significant for KAN1 and REV regulation (P < 0.05) by qRT-PCR.

