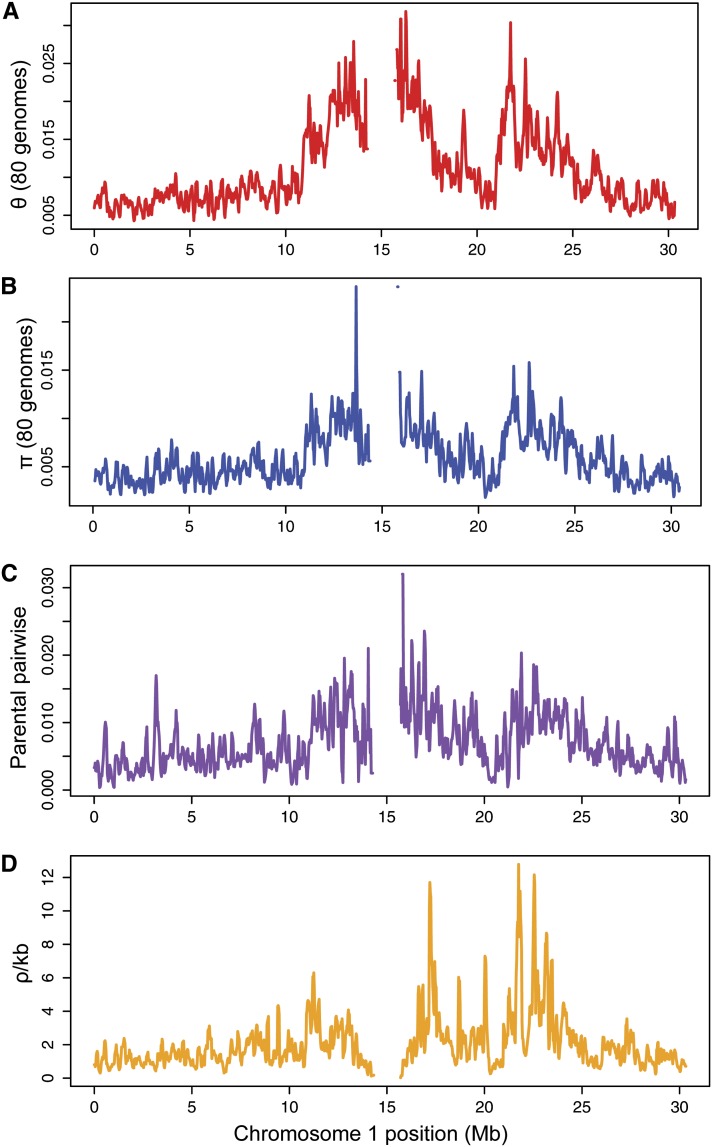
Figure 4.
Distribution of Four Summary Statistics across Chromosome 1.
(A) Species-wide estimates of θ and (B) π were calculated for 1000-bp promoters of genes from the first 80 genomes of the 1001 Arabidopsis genome project (Cao et al. 2011).
(C) Pairwise divergence between the Tsu-1 and Kas-1 genomes for 1000-bp promoters.
(D) Species-wide estimates of recombination rate were calculated by Horton et al. (2012).
Centromere region is excluded. Data smoothed with a sliding 100-kb window (25-kb step). Similar plots for chromosomes 2 to 5 are provided as Supplemental Figures 2 to 5 online.
[See online article for color version of this figure.]

