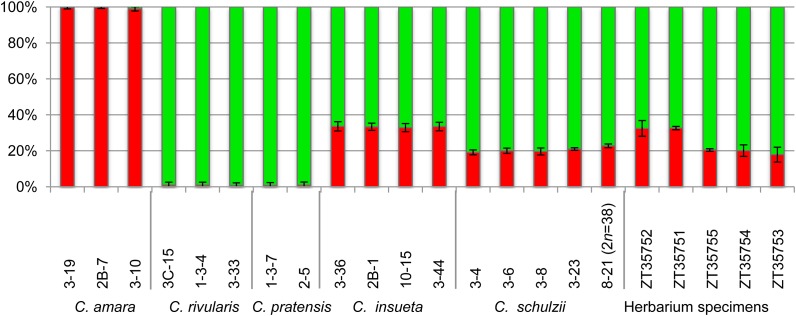
Figure 5.
Ratio of Gene Copy Numbers in Cardamine Accessions from Urnerboden Detected by Pyrosequencing (PyroMark).
The red and green bars show the average ratio of four SNP sites between C. amara and C. rivularis/C. pratensis, respectively; error bars indicate the standard deviations based on the C. amara percentage. The last five columns show the analyzed herbarium specimens of C. × insueta (ZT35752 and ZT35751) and C. × schulzii (ZT35755, ZT35754, and ZT35753).

