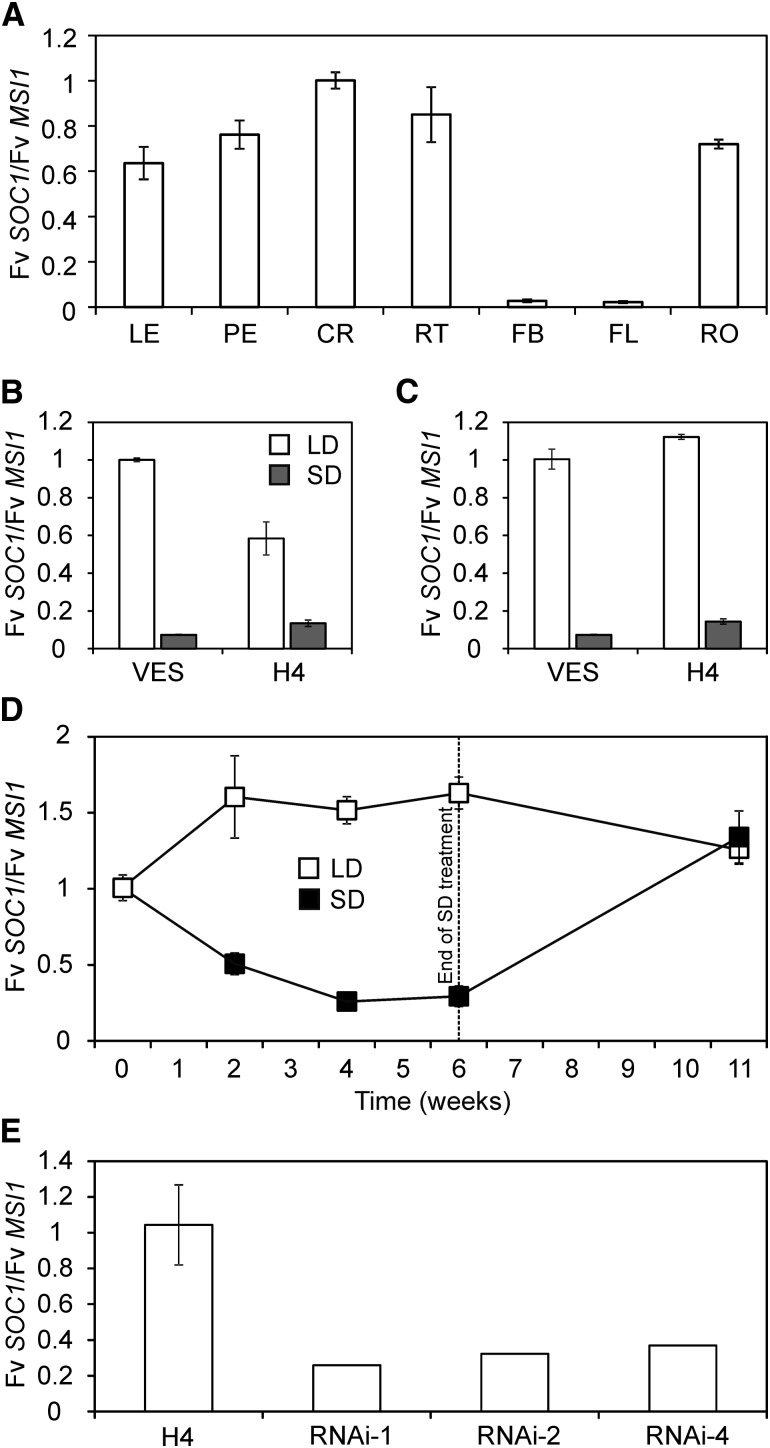
Figure 2.
Spatial Expression Pattern and Regulation of Fv SOC1.
(A) Relative expression of Fv SOC1 in different plant organs. Clonally propagated 2-month-old SD strawberry plants were grown under SDs for 6 weeks followed by standard LDs until anthesis. LE, leaf; PE, petiole; CR, axillary branch crown; RT, runner tip; FB, flower bud; FL, opened flower; RO, root. Mean fold change was calculated relative to axillary branch crown. Error bars represent se; n = 2.
(B) and (C) Relative expression of Fv SOC1 in leaves (B) and shoot apices (C) of SD strawberry (VES) and Hawaii-4 (H4) seedlings. Samples were collected from plants grown under LDs or SDs until the three-leaf stage. Mean fold change was calculated relative to SD strawberry grown under LDs. Error bars represent se; n = 3 to 4.
(D) Time-course analysis of Fv SOC1 relative expression under SDs and LDs. Clonally propagated 5-week-old plants of SD strawberry were subjected to photoperiodic treatments for 6 weeks (weeks 0 to 6) followed by LDs for 5 weeks. Primary shoot apices were analyzed during weeks 0 to 6, and newly formed branch crowns were analyzed at week 11. Mean fold change was calculated relative to week 0. Error bars represent se; n = 3.
(E) Relative expression of Fv SOC1 in shoot apices of Fv FT1-RNAi lines in the H4 background. H4 and three independent Fv FT1-RNAi lines were grown under standard LD conditions and samples were collected at the three-leaf stage. Fold change was calculated relative to H4. Error bar represents se; n = 3 for H4, and n = 1 for transgenic lines, which are shown as biological replicates. See Koskela et al. (2012) for the Fv FT1 expression levels.

