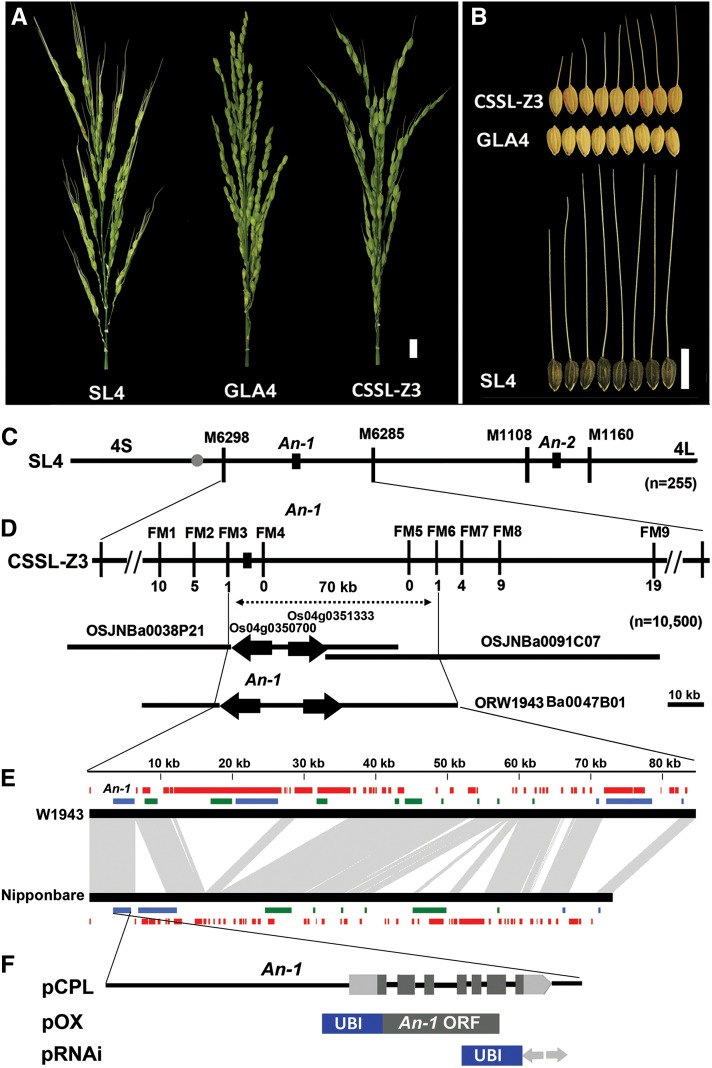
Figure 1.
Map-Based Cloning and Identification of An-1.
(A) Panicle comparison among SL4, GLA4, and CSSL-Z3. Bar = 10 mm.
(B) Awn length comparison among CSSL-Z3, GLA4, and SL4. Bar = 10 mm.
(C) Two QTLs for awn length were identified on chromosome 4 in SL4, and An-1 was first mapped to the interval between the markers M6298 and RM6285, while An-2 localized between the markers M1108 and M1160.
(D) An-1 was further delimited to a 70-kb genomic region between the markers FM3 and FM6, which corresponded to two Nipponbare BACs and one W1943 BAC. FM1 to FM9 are primers used for fine mapping. The numbers underneath the bars indicate the number of recombinants between An-1 and the molecular markers. The black arrows indicate gene direction. Bar = 10 kb.
(E) Comparison of BAC sequence and annotation between W1943 and Nipponbare. Black bars represent genomic sequences of W1943 and Nipponbare. Red bars represent transposon-like and repeat sequences. Green/blue bars represent predicated ORFs. Green bars represent ORFs with a forward direction. Blue bars represent ORFs with a reverse direction. Gray represents regions sharing sequence collinearity between W1943 BAC and Nipponbare BAC. Genes annotated on the BACs are listed in Supplemental Table 2 online.
(F) Gene structure of An-1 and constructs used in An-1 function investigation. pCPL represents the 10-kb W1943 genomic fragment used for the complementation test; pOX contains W1943 An-1 ORF used for ectopic expression and overexpression; pRNAi denotes the RNA interference construct. UBI is a maize Ubiquitin promoter.

