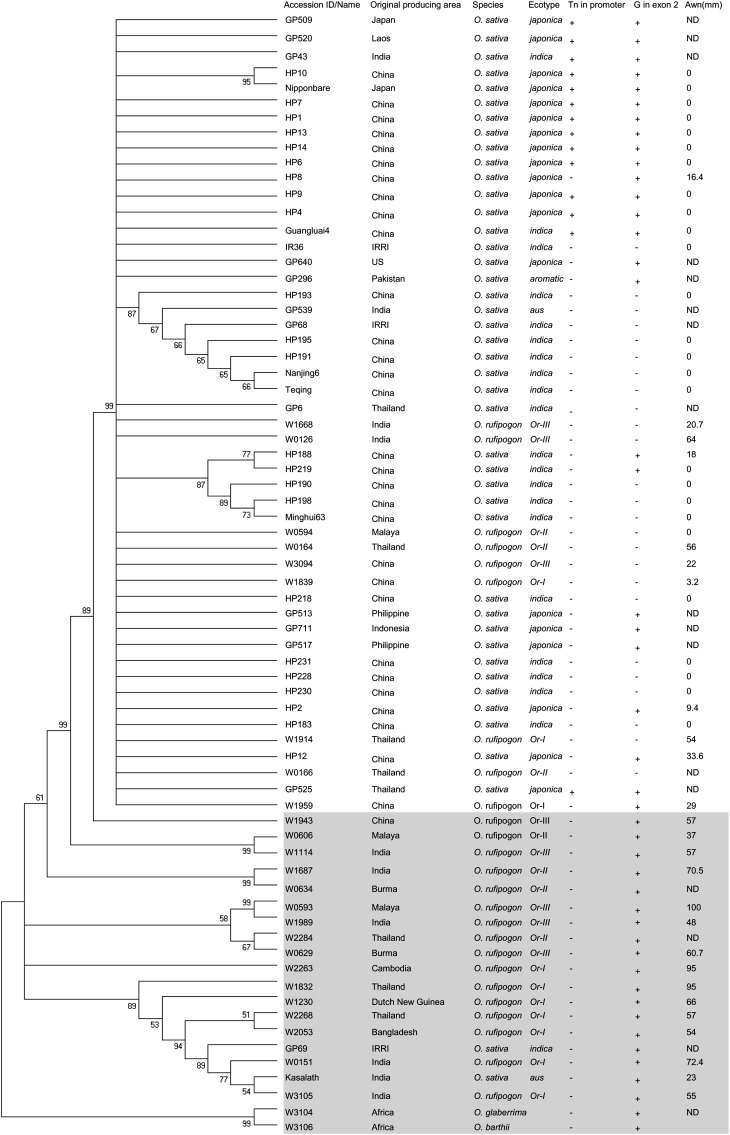
Figure 10.
Phylogenetic Tree of An-1 in Rice.
Maximum parsimony phylogenetic tree of An-1 in rice cultivars and wild relatives. Bootstrap values were estimated (with 1000 replicates) to assess the relative support for each branch. The bootstrap values of 50% and above are indicated on the tree. ND, not detected. Alignments used to generate the phylogeny are presented in Supplemental Data Set 2 online.

