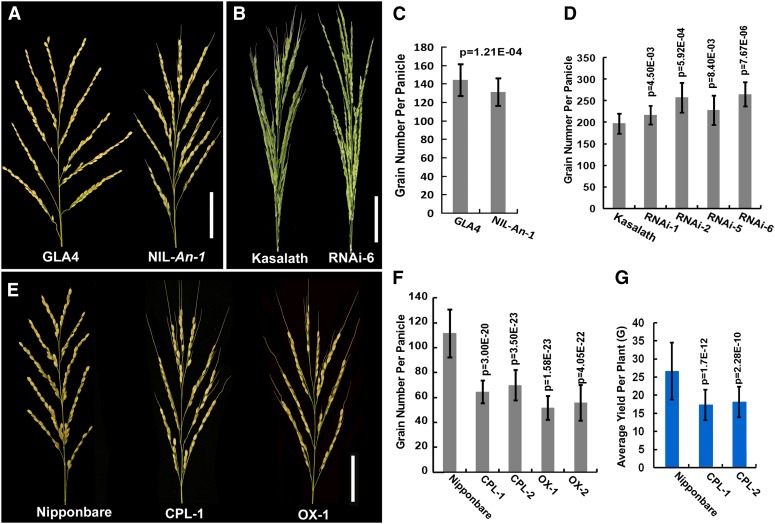
Figure 5.
Grain Number per Panicle and Yield per Plant Comparison.
(A) Photograph of the panicles in GLA4 and NIL-An-1.
(B) Photograph of the panicles in Kasalath and RNAi-6.
(C) Grain number per panicle comparison between GLA4 and NIL-An-1; the grain number per panicle in NIL-An-1 is slightly lower than that in GLA4.
(D) Grain number per panicle comparison among RNAi lines and Kasalath; grain number per panicle was greater in RNAi lines than in Kasalath.
(E) Photograph of the panicles in Nipponbare, CPL-1, and OX-1.
(F) Grain number per panicle comparison among Nipponbare, CPL, and OX lines; grain number was less in CPL and OX than in Nipponbare.
(G) Yield per plant comparison among Nipponbare, CPL-1, and CPL-2.
CPL, An-1 complementation plants; OX, An-1–overexpressing plants; RNAi, An-1 suppression plants. Bars = 50 mm. In (C), (D), and (F), for GLA4, NIL-An-1, Nipponbare, and Kasalath, sample size was n = 60. For transgenic lines, sample size was n = 30. In (G), sample size was n = 48. The statistical significance was at P < 0.05 based on a two-tailed Student’s t test. Error bars represent the sd.
[See online article for color version of this figure.]

