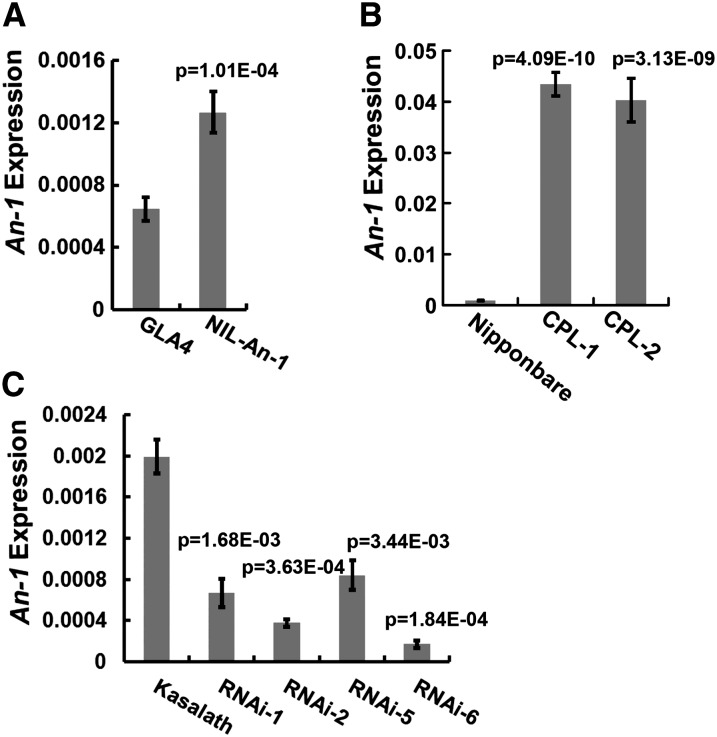
Figure 6.
An-1 Expression Level Comparison.
(A) The An-1 transcript level comparison between GLA4 and NIL-An-1 panicles.
(B) The An-1 transcript level comparison among Nipponbare, CPL-1, and CPL-2 panicles.
(C) The An-1 transcript level comparison between Kasalath and RNAi panicles.
Young panicles <4 cm high were collected and subjected to qRT-PCR. The data represent the average of three independent biological replicates and were normalized to the EF1α gene as a reference. The statistical significance was at P < 0.05 based on a two-tailed Student’s t test. Error bars represent the sd. CPL, An-1 complementation plants; RNAi, An-1 suppression plants.

