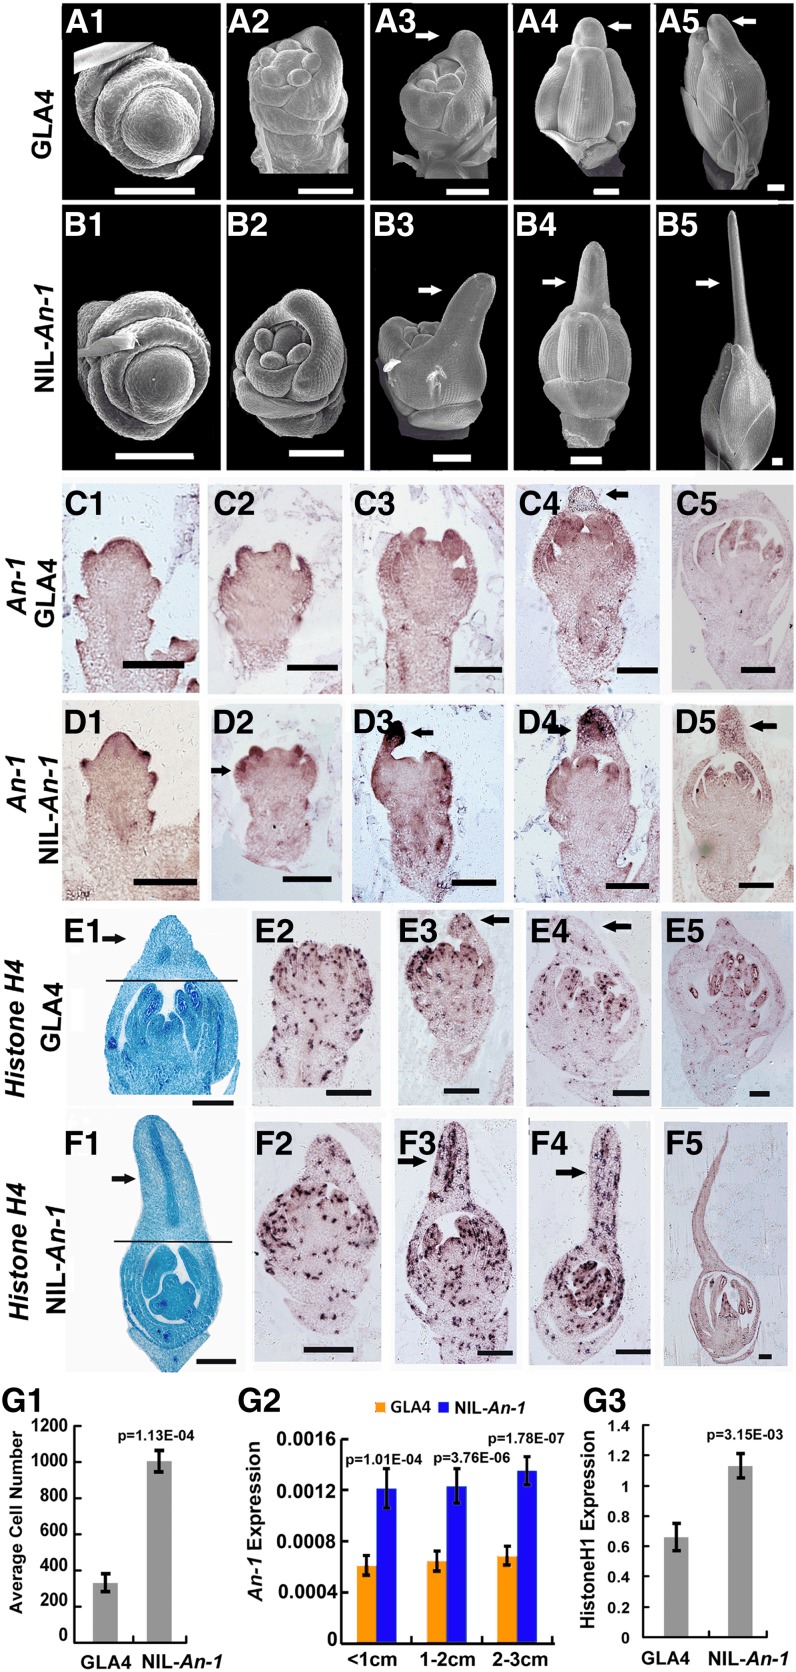
Figure 7.
Awn Development and Expression Analysis of An-1 and Histone Hs in GLA4 and NIL-An-1.
(A1) to (A5) Scanning electron microscopy images of spikelets at different developmental stages in GLA4. Arrows point to the apex of lemma primordia.
(B1) to (B5) Scanning electron microscopy images of spikelets at different developmental stages in NIL-An-1. Arrows point to awn primordia.
(C1) to (C5) Expression patterns of An-1 during spikelet development in GLA4. Arrow points to the apex of lemma primordia.
(D1) to (D5) Expression patterns of An-1 during spikelet development in NIL-An-1. Arrows point to awn primordia.
(E1) A longitudinal histological section of a spikelet at the Sp8e stage in GLA4. The arrow points to the apex of the lemma primordium. The cells above the black line were quantified.
(E2) to (E5) Expression patterns of Histone H4 during spikelet development in GLA4. Arrows point to the apex of lemma primordia.
(F1) A longitudinal histological section of a spikelet at the Sp8e stage in NIL-An-1. The arrow points to awn primordium. The cells above the black line were quantified.
(F2) to (F5) Expression patterns of Histone H4 during spikelet development in NIL-An-1. Arrows point to awn primordia.
(G1) Cell number comparison between the apices of spikelets in GLA4 and awn primordia in NIL-An-1.
(G2) A comparison of An-1 expression in the 1- to 3-cm young panicles of NIL-An-1 and GLA4.
(G3) A comparison of Histone H1 expression in the young panicles of NIL-An-1 and GLA4.
(A1), (B1), (C1), and (D1) Sp4-Sp5, formation of lemma and palea primordia stage.
(A2), (B2) (C2), (D2), (E2), and (F2) Sp6, formation of stamen primordia stage.
(A3), (B3), (C3), (D3), (E3), and (F3) Sp7, formation of carpel primordia stage.
(A4), (B4), (C4), (D4), (E4), and (F4) Sp8e (Sp8 early), differentiation of ovule and pollen stage.
(A5), (B5), (C5), (D5), (E5), and (F5) Sp8l (Sp8 late), differentiation of ovule and pollen stage.
In (G1), sample size was as follows: GLA4 (n = 8) and NIL-An-1 (n = 8). In (G2) to (G3), the data represent the average of three independent biological replicates and were normalized to the EF1α gene as a reference. The statistical significance was at P < 0.05 based on a two-tailed Student’s t test. Error bars represent the sd. Bars = 100 μm.

