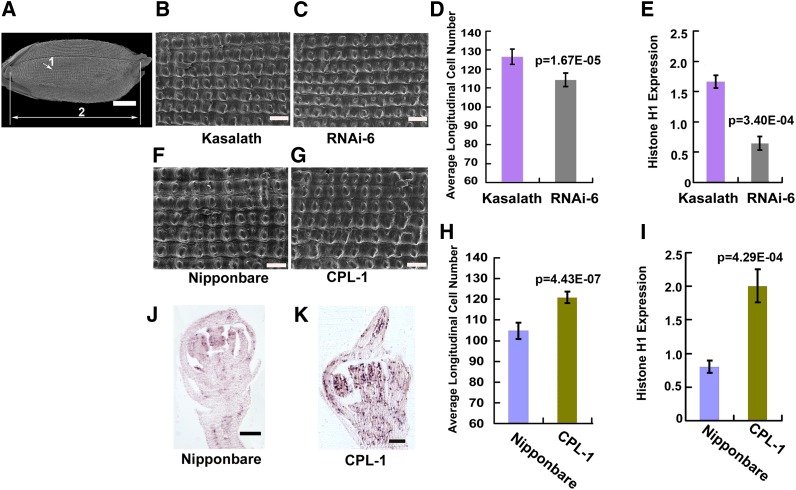
Figure 8.
Epidermis Cell Number Comparison and Histone Hs Expression Analysis.
(A) Scanning electron microscopy photograph of a whole grain. Arrow 1 indicates the magnified area on the outer epidermis of the lemma, and arrow 2 represents the longitudinal axis along which cell number was quantified. Bar = 1 mm.
(B) and (C) Scanning electron microscopy photographs of lemma outer epidermis cells in Kasalath and RNAi-6 grains. Bars = 100 μm.
(D) Comparison of average cell number along the longitudinal axis between Kasalath and RNAi-6 grains.
(E) qRT-PCR analysis of Histone H1 expression in 3- to 4-cm young panicles of Kasalath and RNAi-6.
(F) and (G) Scanning electron microscopy photographs of lemma outer epidermis cells in Nipponbare and CPL-1 grains. Bars = 100 μm.
(H) Comparison of the average cell number along the longitudinal axis between Nipponbare and CPL-1 grains.
(I) qRT-PCR analysis of Histone H1 expression in the 3-4 cm young panicles of Nipponbare and CPL-1.
(J) Expression pattern of Histone H4 in spikelets at the Sp8l stage in Nipponbare.
(K) Expression pattern of Histone H4 in spikelets at the Sp8l stage in CPL-1. Bars = 100 μm.
CPL, An-1 complementation plants; RNAi, An-1 suppression plants. In (D) and (H), sample size was n = 8 for all analyses. In (E) and (I), the data represented the average of three independent biological replicates and were normalized to the EF1α gene as a reference. The statistical significance was at P < 0.05 based on two-tailed Student’s t test. Error bars represent the sd.

