Figure 4.
SAA in Plants Is Abiotic Stress Specific.
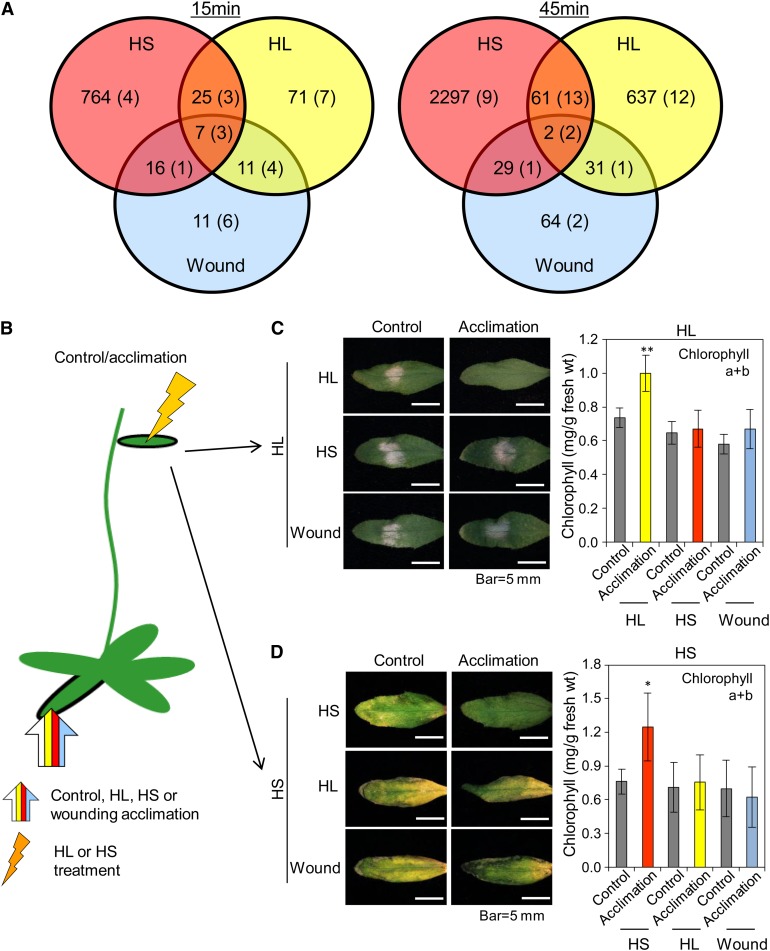
(A) Venn diagrams showing the accumulation of stress-specific transcripts and metabolites (in parentheses) in systemic tissues of wild-type plants subjected to a local stimulus of HS, HL, or wounding (wound) for 15 or 45 min. Experimental design for stress application is similar to Figure 3A. See also Supplemental Figures 3 to 5 and Supplemental Data Sets 1 to 22 online.
(B) Experimental design showing the application of HL, HS, or wounding to local leaves (wide arrow) and the subsequent application of HL or HS to systemic leaves (jagged arrow).
(C) Images of systemic leaves (left) and graphs of chlorophyll content (right; n = 15) showing that local HL stimulus can only protect systemic leaves against HL.
(D) Images of systemic leaves (left) and graphs of chlorophyll content (right; n = 15) showing that local HS stimulus can only protect systemic leaves against HS.
In (C) and (D), error bars = sd. Student’s t test significant at *P < 0.05 or **P < 0.01.

