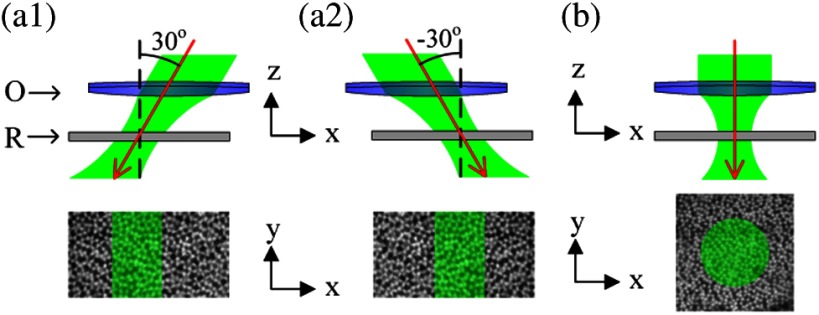
Fig. 1.
Schematic diagram of stimulation patterns. O: objective; and R: retina. Black dash lines indicate the normal axis of retinal surface. Red solid lines indicate the incident directions. Top panels are cross-section view (transverse or plane) and the bottom panels are enface view (axial or plane). (a1) Rectangular stimulus (bottom panel) with 30-deg incident angle with respect to the normal axis of retinal surface (top panel). (a2) Rectangular stimulus (bottom panel) with incident angle (top panel). (b) Circular stimulus (bottom panel) with 0-deg incident angle (top panel). The retina was placed with the ganglion cell layer facing toward the objective.

