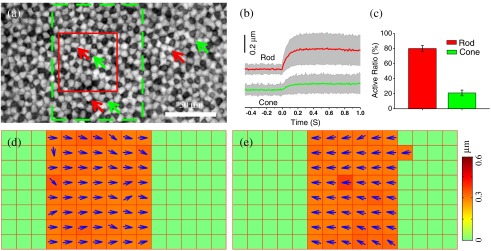
Oblique stimulus-evoked photoreceptor displacements. (a) Near infrared (NIR) image of frog photoreceptor mosaic pattern. Green dashed window illustrates stimulus area. Red rectangle indicates the area shown in Video
1 (QuickTime, 7.7 MB) [URL:
http://dx.doi.org/10.1117/1.JBO.18.10.106013.1] which displays a pair of pre- and poststimulus images alternating repeatedly 20 times. Red and green arrows point to rods and cones, respectively. (b) Average displacement of 25 rods and cones which were randomly selected from the stimulus area. The gray shadow indicates the standard deviation. (c) Active ratios of rods and cones at time 200 ms after the onset of the stimulus. Six trials were used. For each trial, 25 rods and cones were randomly selected. Thus, in each trial, the active ratio was calculated as the number of active rods or cones divided by 25. (d) Retinal displacements associated with the 30-deg stimulus [Fig.
1(a1)] at 200 ms. Dynamic changes of retinal displacement maps from
to 1000 ms are displayed in Video
2 (QuickTime, 6.7 MB) [URL:
http://dx.doi.org/10.1117/1.JBO.18.10.106013.2]. (e) Retinal displacements associated with the
stimulus [Fig.
1(a2)] at 200 ms. Each square in (d) and (e) represents a
area of the retina. Transient displacements within the small square were averaged.

