Figure 3.

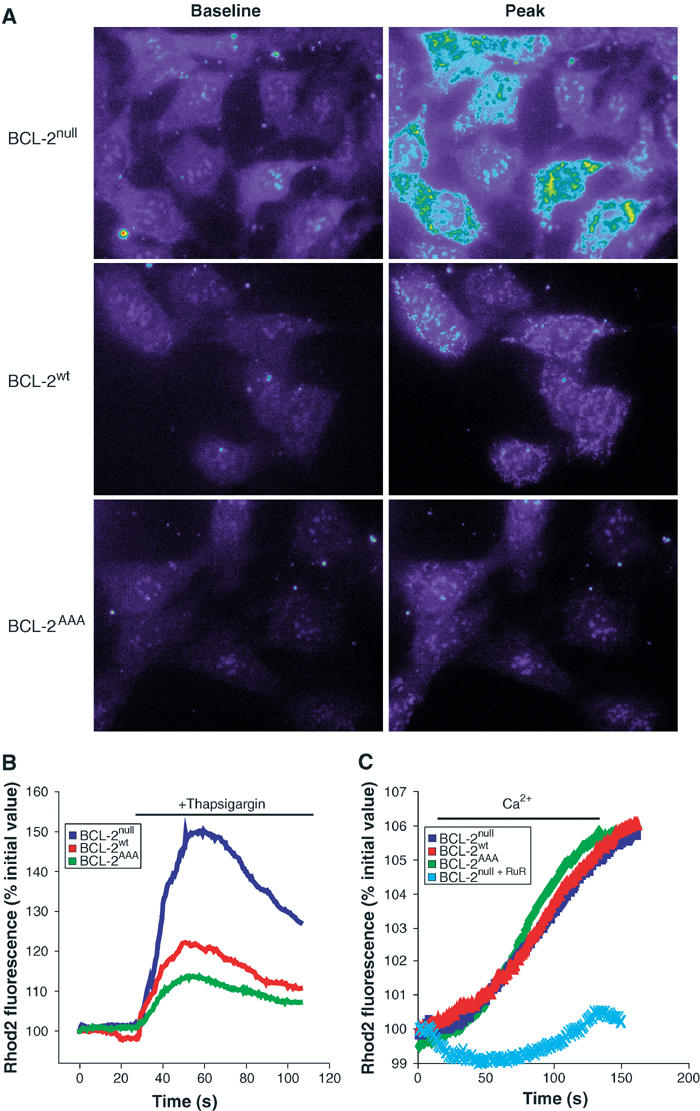
Mitochondria in BCL-2AAA-expressing cells take up lower levels of calcium following release from the ER. (A) MEF lines loaded with Rhod-2 were treated with 200 nM thapsigargin, and sequential images were taken. Baseline and peak fluorescence images were selected for comparison. Complete image sequences are given in Supplementary data, Movies 1–3. (B) For the images in (A), mitochondrial areas were selected, and normalized fluorescence intensity values were measured over time (see Materials and methods). (C) MEFs loaded with Rhod-2 were permeabilized with 0.001% digitonin and exposed to 14.5 μM Ca2+. Ruthenium red (100 μM), an inhibitor of the mitochondrial calcium uniporter, was added where indicated.
