
Figure 7.
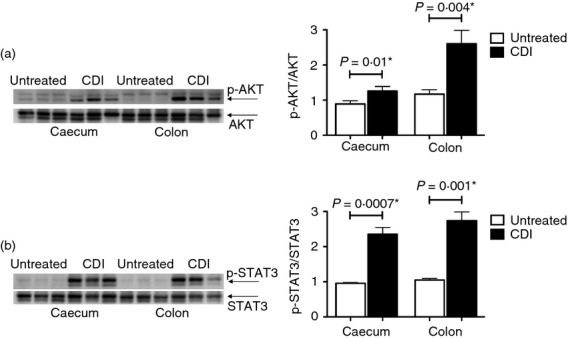
Phosphorylation of AKT and signal transducer and activator of transcription 3 (STAT3) in the caeca and colons of Clostridium difficile-infected (CDI) mice. Protein lysates from the caeca and colons of untreated and CDI mice were used to evaluate the phosphorylation of AKT (n = 6 pairs) (a), and STAT3 (n = 6 pairs) (b). In each case, the panel on the left shows the image of the immunoblot for the evaluated molecule for three pairs of caeca and colons and the bar graph on the right depicts the mean ± SEM of the response for all the six evaluated pairs. A P-value ≤ 0.05 indicates a significant difference between the untreated and CDI samples and is marked with a ⋆.