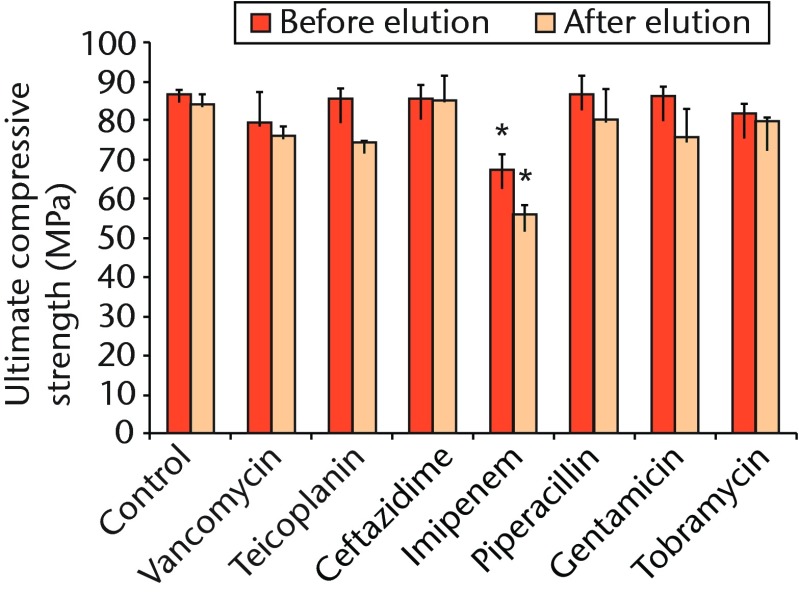
Fig. 3.
Bar chart showing the mean ultimate compressive strength of the cement samples before and after the 14-day broth elution assay compared with cement without antibiotics (control). The bars denote the mean of three tests for each antibiotic with the standard error of the mean. Asterisks denote a significant difference (p < 0.01) when compared with the control.

