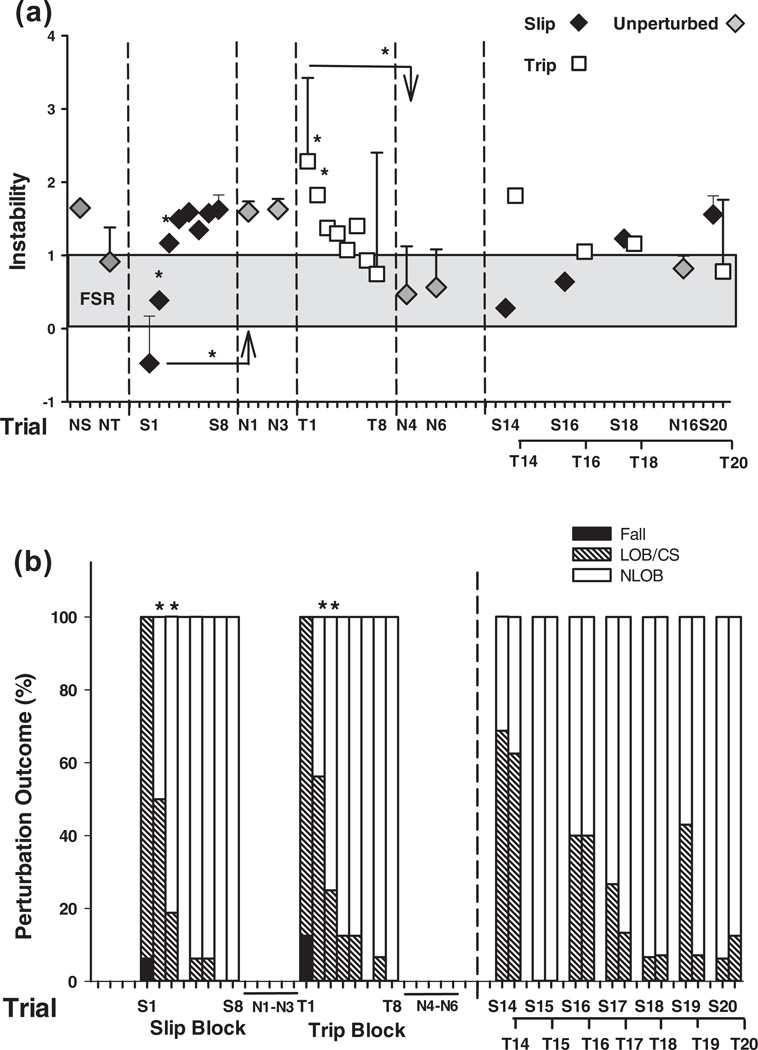
Fig. 6.
Shown are (a) group means (±SD) of adaptive changes in post-slip/trip stability (reactive control) and (b) outcomes on selected trials which include the first block of slips (S1 through S8) and trips (T1 through T8) for the training group. Stability during a slip (backward stability) was measured as the shortest distance between the instantaneous COM state and predicted FSR limits for backward loss of balance under slip conditions. Also represented (a) are stability values on selected slip and trip trials from the mixed block (14, 16, 18 and 20) and (b) the percentage outcome on all trials of the mixed block. Stability during a trip (forward instability) was measured as the shortest distance between the instantaneous COM state and predicted FSR limits for forward loss of balance under non-slip conditions. Stability value of greater than 1 indicated less stability against forward balance loss; stability value between 0 and 1 indicated that the COM state was within the FSR. Stability value of less than 0 indicated that the COM state fell outside of the FSR where backward balance loss was predicted. Also shown are unperturbed trials after the slip and trip blocks (N1–N3 and N4–N6 trials) and the last unperturbed trial of the entire protocol (N16). NS represented the data for the regular walking trial prior to the first novel perturbation (i.e., S1). NT represented the data for the regular walking trial prior to S1. Both NS and NT were obtained at left foot touchdown. (b) **p < 0.05; **p < 0.01; **p < 0.001.

