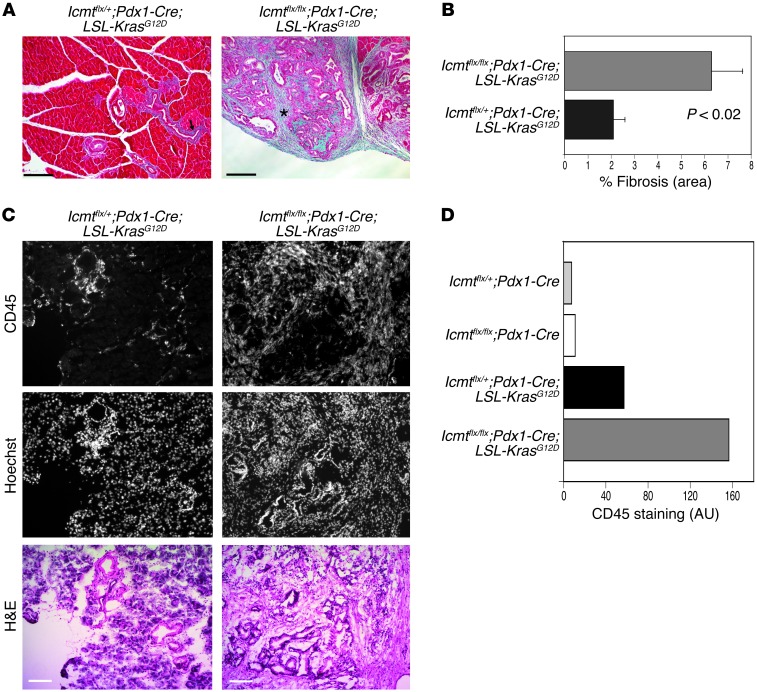
Figure 3. Accelerated fibrosis and leukocytic infiltration associated with PanINs in mice expressing oncogenic KRAS in the setting of ICMT deficiency.
(A) Masson’s trichrome staining of sections of fixed, paraffin-embedded pancreas from 2-month-old mice of the indicated genotypes. The arrow indicates fibrosis surrounding PanIN in pancreas from an Icmtflx/+;Pdx1-Cre;LSL-KrasG12D mouse, while the asterisk indicates more extensive fibrosis in ICMT-deficient pancreas. Scale bars: 200 μm. (B) Percentage of fibrotic areas in five low-power fields (mean ± SEM, n = 8, P < 0.05). (C) Frozen sections of pancreata from 2-month-old mice of the indicated genotypes stained by immunofluorescence for CD45 (leukocyte common antigen) and counterstained with Hoechst to mark nuclei. Also shown in the bottom panels are H&E stains of adjacent frozen sections. Scale bars: 100 μm. (D) Quantification of the average amount of CD45 staining per frozen section (five sections per mouse). Data shown are the mean of two age-matched mice for each genotype.

