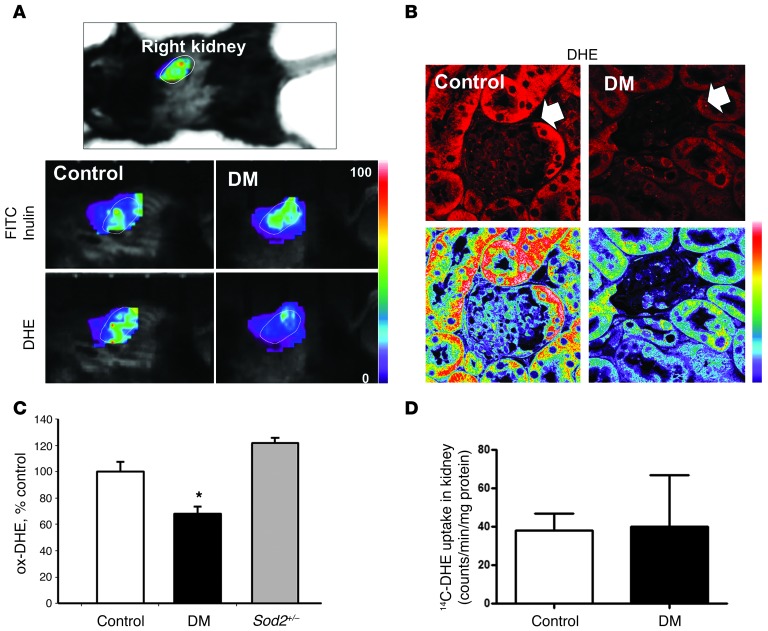
Figure 1. Imaging of kidney superoxide production in normal and diabetic mice.
(A) Live animal imaging of kidney through the intact skin in a prone, isofluorane-anesthetized mouse. Kidneys were first localized using the FITC channel, and then the filter settings were changed to the ox-DHE channel (Ex 470 nm, EM > 590 nm) to image superoxide production in control and STZ-induced diabetic mice (DM). Fluorescence is shown using a linear pseudocolor scale (images representative of n = 6 mice per group). Original magnification, ×1 (top panel); ×1.25 (bottom panels). (B) ox-DHE fluorescence (red, top; linear pseudocolor, bottom) in kidney slices prepared from DHE-injected control and DM mice with less in vivo oxidation in DM kidney. Diabetic kidneys had a reduced level of glomerular DHE oxidation-derived fluorescence (white arrow). Original magnification, ×63. (C) Kidneys from Sod2+/– mice, which are deficient in mitochondrial SOD, were evaluated and demonstrated the expected higher superoxide than controls. n ≥ 15 each for control and diabetic groups, n = 3 for Sod2+/– group, *P < 0.05 vs control. (D) In vivo analysis of [14C]-labeled DHE with STZ-diabetic mice and control mice.

