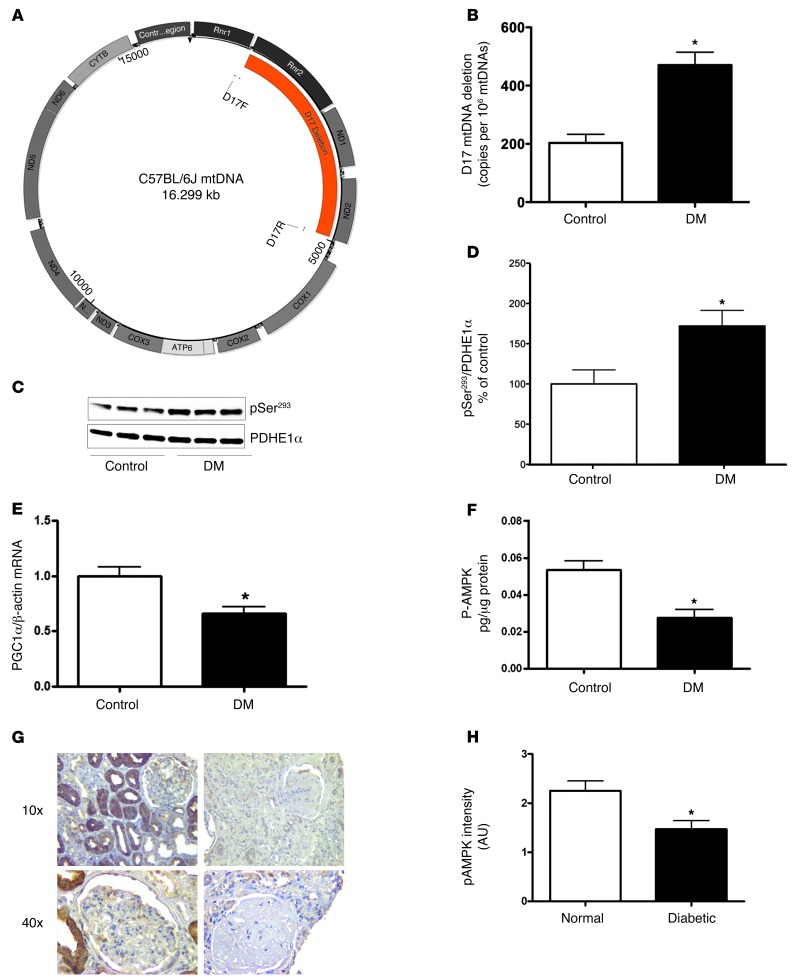
Figure 4. Mitochondrial structure and function, PGC1α, and p-AMPK in the diabetic kidney.
(A) Map of murine mtDNA indicating the location of the D17 deletion. (B) Quantitation of the D17 mtDNA deletion in kidney DNA from control and diabetic mice, (n = 6 per group, *P < 0.05). (C) Representative immunoblot analysis of phosphorylated PDHE1α-pSer293 in kidney mitochondria (upper panel) and total PDHE1α (lower panel) from control and diabetic mice. (D) Quantitative analysis of the immunoblot results showing that, under conditions of diabetes, PDH is hyperphosphorylated (n = 6 per group, *P < 0.05). (E) PGC1α is reduced in diabetic kidneys as demonstrated by real time PCR analysis of control and diabetic kidneys (n = 6 per group, *P < 0.05) and immunofluorescence staining with an antibody to PGC1α in Supplemental Figure 2A. (F) p-AMPK was reduced in the diabetic kidneys, as demonstrated with an ELISA using kidney cortex from control and diabetic mice (n = 7 per group, *P < 0.05) and with immunofluorescence staining with an antibody specific for p-Thr172 of the AMPKα subunit in Supplemental Figure 2B. (G) Representative images of immunostaining of p-AMPK in normal, diabetic kidney and negative control. Original magnification, ×40. (H) Semiquantitative scoring of p-AMPK intensity in glomeruli of human normal (n = 10) and diabetic kidney (n = 7 per group, *P < 0.05).

