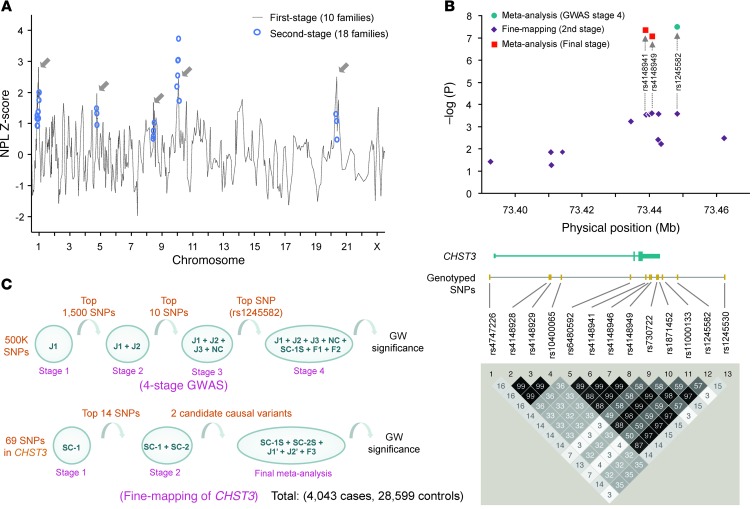
Figure 1. Linkage and association analyses for LDD.
(A) NPL Z-score plot of the 2-stage genome-wide linkage analysis. Scores of the first-stage analysis using 10 Southern Chinese families are plotted against the position of the microsatellite markers across the different chromosomes (gray dotted line). Suggestive regions (gray arrows) were then analyzed in the second stage using additional markers and an additional 8 families; the total scores of these markers are denoted by blue circles. A score of 3 was used as the threshold for significance. (B) Workflow of the 4-stage GWAS and the 3-stage fine-mapping of CHST3 in the identification of potential causal variants reaching genome-wide (GW) significance. The number of SNPs selected for analysis at each stage, the cohort used, and the total number of cases and controls in the study are indicated. (C) Position of the SNPs in relation to CHST3. Purple diamonds, –log10(P) values; red squares, P values of the 2 significant SNPs within the 3′UTR in a meta-analysis using 3 population cohorts; blue circle, original SNP from the GWAS and replication studies. The physical map of the gene structure of CHST3 is shown in relation to the physical position in chromosome 10. The LD map (r2) was generated from the 13 SNPs genotyped from the SC-1 + SC-2 cohort (n = 2,999).

