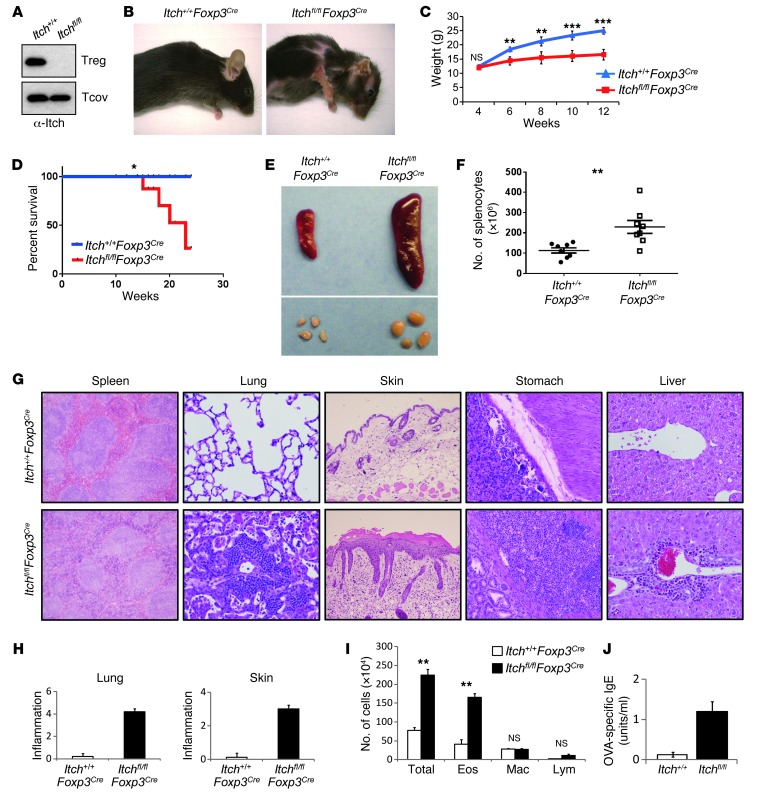
Figure 1. Treg cell–specific Itch deletion causes severe inflammation.
(A) Immunoblot analysis of Itch in splenic CD4+YFP– conventional T cells (Tcov) and CD4+YFP+ Treg cells sorted from Itch+/+Foxp3Cre (Itch+/+) and Itchfl/flFoxp3Cre (Itchfl/fl) mice. Note that the upper blot is the same as that in Figure 7C. (B) Severe dermatitis in Itchfl/flFoxp3Cre mice at the age of 16 weeks. (C) Body weight of 4- to 12-week-old Itch+/+Foxp3Cre and Itchfl/flFoxp3Cre mice. (D) Kaplan-Meier survival curve of Itch+/+Foxp3Cre and Itchfl/flFoxp3Cre mice. (E) Splenomegaly and lymphadenopathy in Itchfl/flFoxp3Cre mice. (F) Spleen cellularity in Itch+/+Foxp3Cre mice (black circles) and Itchfl/flFoxp3Cre mice (white squares). (G) Representative H&E-stained tissue sections from 10-week-old Itch+/+Foxp3Cre and Itchfl/flFoxp3Cre mice. Original magnification, ×200 and ×100 (skin). (H) Inflammation scores. (I) Enhanced antigen-induced airway inflammation in Itchfl/flFoxp3Cre mice. Itch+/+Foxp3Cre and Itchfl/flFoxp3Cre mice (n = 3 each) were immunized i.p. with OVA in alum. Eighteen days later, mice were challenged by i.n. administration of OVA for 4 consecutive days. Total numbers of eosinophils (Eos), monocytes/macrophages (Mac), and lymphocytes (Lym) were calculated in BAL fluid 24 hours after the last OVA challenge. (J) Serum levels of OVA-specific IgE were measured by an ELISA assay. Data are compiled from two independent experiments with four mice per group. Error bars indicate the mean (± SD). *P < 0.05; **P < 0.01; ***P < 0.001 (unpaired 2-tailed Student’s t test).

