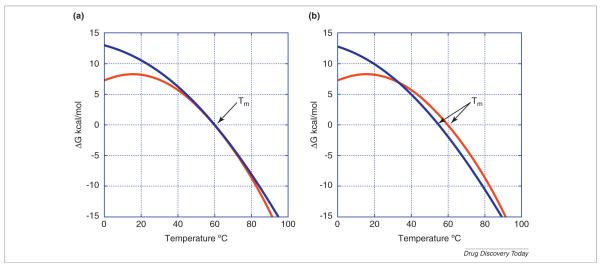
FIGURE 1.
The temperature dependence of the Gibbs energy of protein stability calculated for typical parameters obtained for globular proteins [5,6]. Panel A illustrates the influence of ΔCp on the curvature of the temperature dependence. Both proteins have a Tm of 60°C but the red one a ΔCp of 2.5 kcal/K mol compared to 1.5 kcal/K mol for the blue curve. Panel B illustrates the reversal of the stability rank order. In this case the blue protein has a lower Tm (55°C) but a higher stability at room temperature and below. In this case also ΔCp is 2.5 kcal/K mol for the red curve compared to 1.5 kcal/K mol for the blue curve. In all cases ΔH at Tm was assumed to be 120 kcal/mol.

