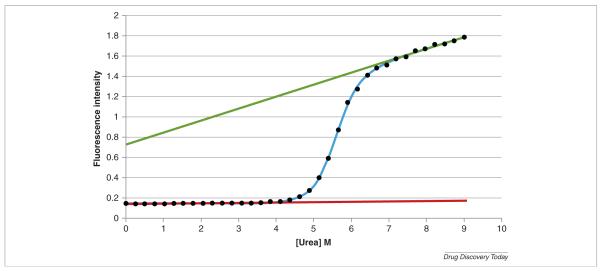
FIGURE 2.
Urea denaturation of cytochrome c at pH 5. The experiments were performed with an AVIA 2304 Automated Protein Denaturation System using intrinsic fluorescence detection (excitation wavelength 280 nm, emission wavelength 356 nm). The final concentration of cytochrome c was 0.025 mg/mL. The AVIA instrument automatically generated a gradient of 36 different urea concentrations equally spaced between 0 and 9 m. Each of the 36 unique solutions was generated with identical protein concentrations and identical buffer concentrations. This group of solutions at pH 5.00 was one of a larger group of automatically prepared solutions, each group set to one specific pH value. The top (green) and bottom (red) straight lines correspond to the calculated characteristic values for the native and denaturated states. The solid line through the points is the best non-linear least squares fit to the data (see text for details).

