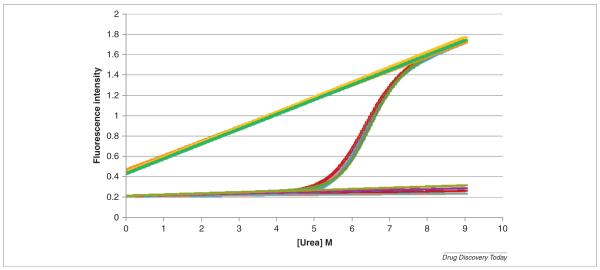
FIGURE 5.
Four independent urea denaturation curves for cytochrome c at pH 7.0. The figure illustrates the level of reproducibility obtained by the AVIA 2304 Automated Protein Denaturation System. All samples were prepared automatically by the instrument starting from stock basic and acid buffer components and a stock protein solution. Analysis of the data yields the following thermodynamic parameters: ΔG° = 10.09 ± 0.12 kcal/mol; m = 1.4 ± 0.08 kcal/mol m; C1/2 = 6.3 ± 0.07 m.

