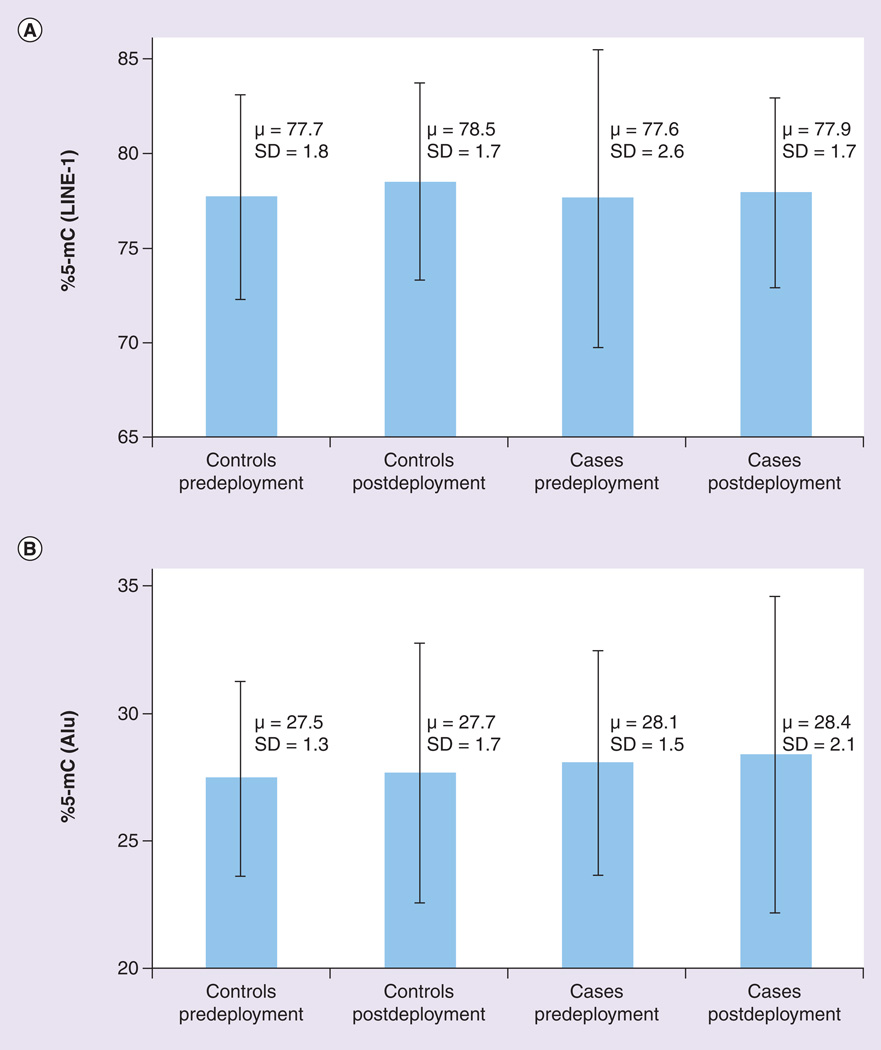
Figure 1. Comparison of mean levels of methylation (percentage 5-methyl-cytosine) in repetitive elements for controls predeploment, controls postdeployment, cases predeployment and cases postdeployment.
(A) LINE-1. Comparison of controls pre- and post-deployment via paired t-test: p = 0.01. Comparison of cases pre- and post-deployment via paired t-test: p = 0.15. Comparison of cases and controls predeployment via simple t-test: p = 0.74. Comparison of cases and controls postdeployment via simple t-test: p = 0.07. (B) Alu. Comparison of controls pre- and post-deployment via paired t-test: p = 0.64. Comparison of cases pre- and post-deployment via paired t-test: p = 0.20. Comparison of cases and controls predeployment via simple t-test: p = 0.01. Comparison of cases and controls postdeployment via simple t-test: p = 0.09. %5-mC: Percentage 5-methyl-cytosine; LINE-1: Long interspersed nucleotide element 1; SD: Standard deviation.

