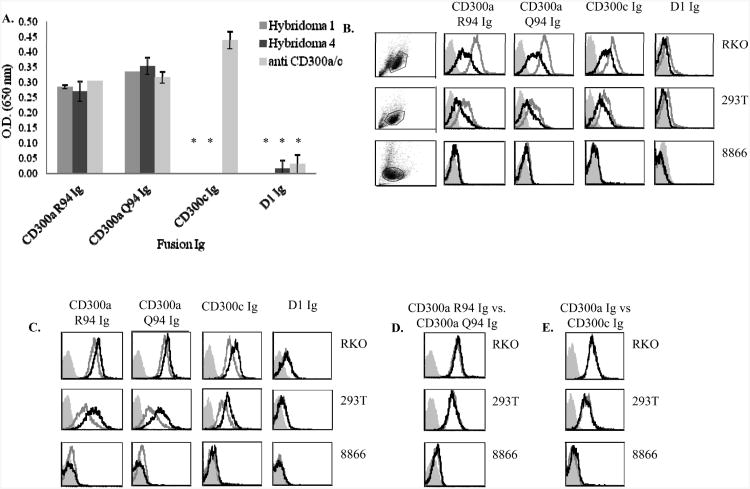
Figure 4. Tumor cells express a trypsin sensitive ligand for CD300.
(A) Fusion proteins (indicated in the X axis) were incubated on ELISA plates and ELISA assays were performed with the indicated mAbs. Data are shown as means and ± SD of three replicates and are representative out of three independent experiments performed. **p≤0.004, ***p≤0.001, t- test. (B) 8866, RKO and 293T cells were harvested with or without trypsin (black and grey line histogram respectively) and FACS staining was performed. Background (filled gray histogram) is the staining with allophycocyanin-conjugated F(ab')2 goat anti-human IgG only. (C) The various tumor cells indicated in the figure were harvested without trypsin and treated with medium with or without calcium (black and grey open histograms respectively). Background (filled gray histogram) is the staining with allophycocyanin-conjugated F(ab')2 goat anti-human IgG only. (D) Binding of CD300a R94 Ig and CD300a Q94 Ig (black and grey open histogram respectively) to various tumor cell lines. (E) Binding of CD300a Ig and CD300c Ig (black and grey open histogram respectively) to various tumor cell lines. (B-D) Data shown are representative of one out of three independent experiments performed.

