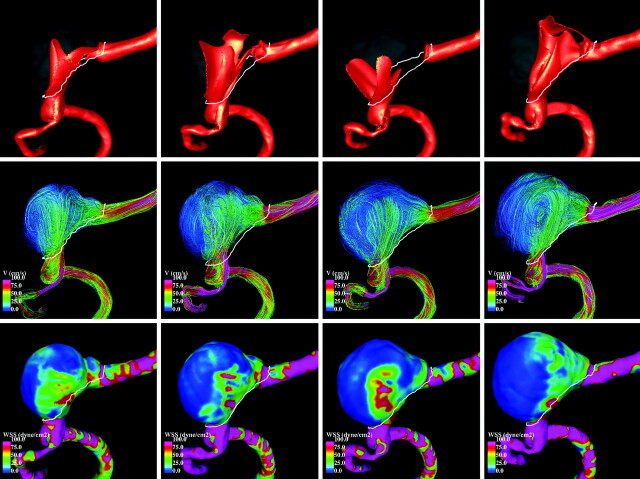
Fig 5.
Hemodynamic visualizations at peak systole during aneurysm progression (RL view). Left to right: Four stages during aneurysm growth. Top to bottom: Isovelocity surfaces showing the inflow streams, velocity color-coded streamlines showing flux complexity (pink is maximum velocity, blue is minimum), and WSS distribution showing stress intensity on the wall (pink is maximum, blue is minimum).

