
Figure 2.
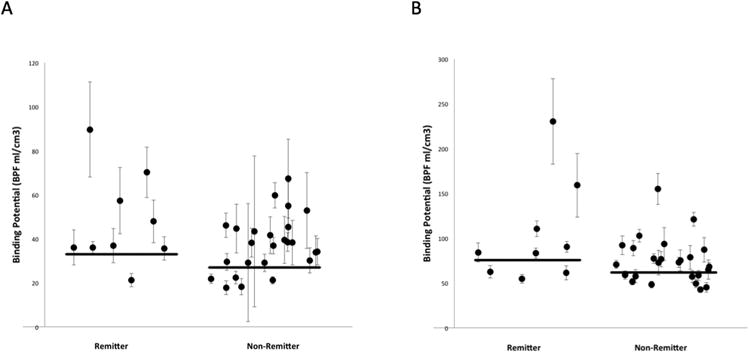
Scatter plots of BPF values within two representative regions of interest, the raphe nucleus (A) and the hippocampus (B). Data are divided into remitter and non-remitter groups. Error bars indicate weights that reflect the level of uncertainty for each value. Horizontal lines mark the weighted mean values for each group. X values are computer generated random numbers for each subject.