
Figure 4. Noninvasive near-infrared imaging of tau pathology in living tau Tg mice using pulsed laser optics and PBB5.
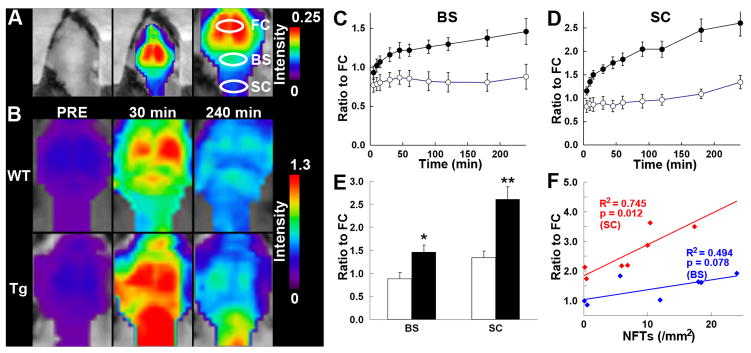
(A) Baseline autofluorescence signals (middle) are overlaid on the visible background image of a shaven non-Tg WT mouse head (left). Ellipsoidal ROIs are defined above the frontal cortex (FC), brain stem (BS) and cervical spinal cord (SC) guided by a relatively intense emission from the FC region (right). (B) Fluorescence intensity maps in 12-month-old WT (top) and PS19 (Tg; bottom) mice before and at 30 and 240 min after the intravenous administration of PBB5 (0.1 mg/kg). The intensity maps (A, B) are normalized by the FC ROI value at 30 min after tracer injection. Long-lasting retention of the tracer was noted in the BS and SC ROIs of the Tg mouse. C, D, Target-to-FC ratios of fluorescence intensity in the BS (C) and SC (D) ROIs over the image acquisition time in the WT (open circles; n = 7) and PS19 (closed circles; n = 7) mice. There were significant main effects of time, region and genotype in 2-way, repeated-measures ANOVA (time, F(11, 132) = 17.6, p < 0.001; region, F(1, 12) = 29.9, p < 0.001; genotype, F(1, 12) = 23.6, p < 0.001). (E) Target-to-FC ratios in the BS and SC ROIs of the WT (open columns) and tau Tg (closed columns) mice at 240 min after tracer injection. *, p < 0.05; **, p < 0.01; 2-way repeated-measures ANOVA with Bonferroni’s post hoc analysis. (F) Scatterplots of target-to-FC ratios at 240 min versus the number of FSB-positive NFTsper unit area of postmortem 20 -μm tissue slices in BS (blue symbols) and SC (red symbols) ROIs of tau Tg mice. Solid lines represent regressions; p values were determined by t-test. Vertical bars in the graphs represent SEs.