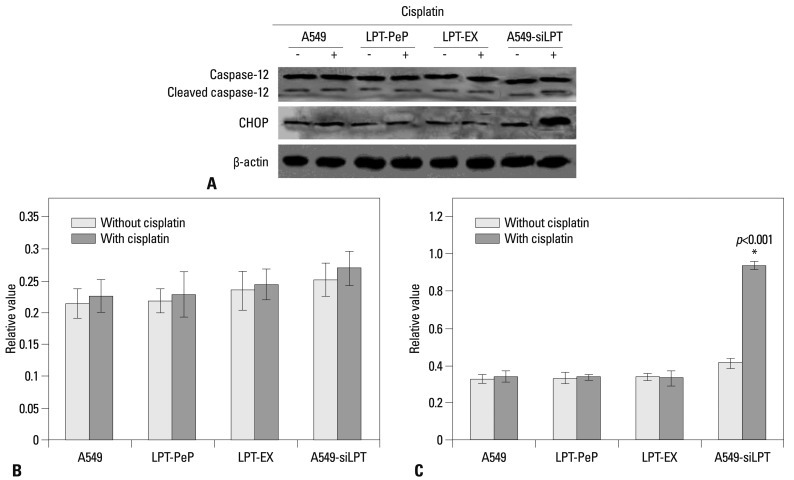
Fig. 7.
Changes of ER stress-associated events in the cells expressing leptin. (A) The levels of CHOP and caspase-12 in A549, A549-siLPT, LPT-PeP, and LPT-EX cells were evaluated by individual western blots. (B) Statistical analysis of Cleaved caspase-12. (C) Statistical analysis of CHOP. The average gray value of each preparation was evaluated by the calculation of gray scan value of each preparation vs. that of β-actin protein. The mean data of each preparation were the results of three independent western blots scan and calculation, and indicated as mean±SD. Statistical differences of the data of cisplatin treatment compared with that of non-treatment are illustrated as *p<0.001. ER, endoplasmic reticulum; siLPT, siRNA against leptin.

