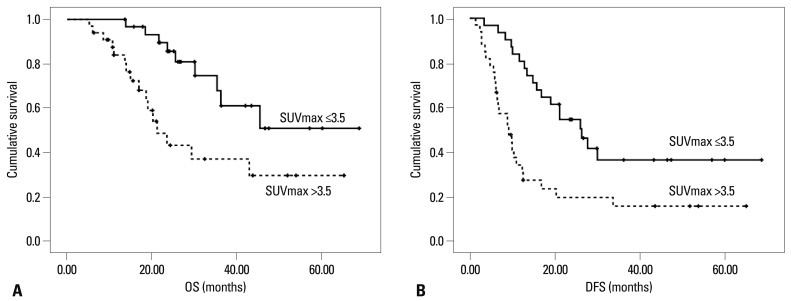
Fig. 1.
Overall survival (OS) and disease-free survival (DFS) in low SUVmax and high SUVmax groups. Tick marks on curves indicate drop-outs. (A) Cumulative survival rate was higher in the low SUVmax group (≤3.5; continuous line) than the high SUVmax group (>3.5; dotted line) (p=0.011). (B) Cumulative disease-free rate was also higher in the low SUVmax group (p=0.002). SUVmax, maximum standardized uptake value.

