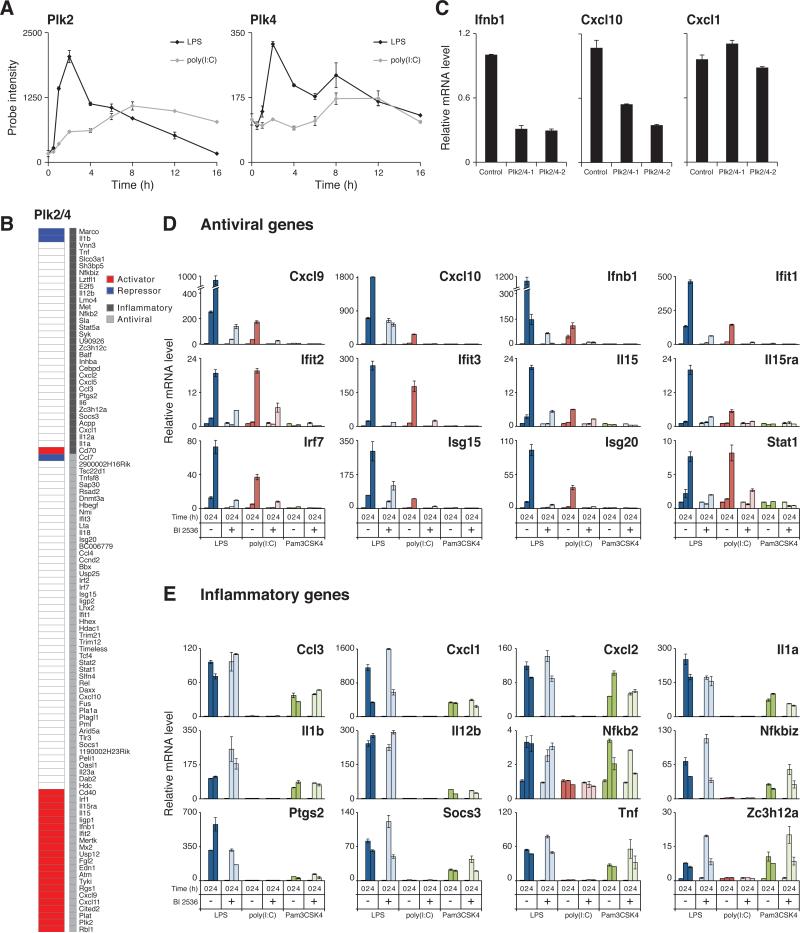
Figure 4. Polo-like kinase (Plk) 2 and 4 regulate the antiviral program.
(A) Similarity of Plk2 and Plk4 mRNA expression profiles. Shown are mRNA levels (from Figure 1B) of Plk2 (left) and Plk4 (right) following stimulation with LPS (black) or poly(I:C) (grey).
(B) Double knockdown of Plk2 and 4 represses the antiviral signature. Shown are significant changes in expression of TLR signature genes (rows) following double knockdown of Plk2 and 4. Red and blue mark significant hits as in Figure 2, only for genes where the effect was consistent between the two independent combinations of shRNAs.
(C) Double knockdown of Plk2 and 4 represses antiviral cytokine mRNAs. Shown are expression levels (qPCR) relative to control shRNAs (Control) for two antiviral cytokines (Ifnb1 and Cxcl10) and for an inflammatory cytokine (Cxcl1), following LPS stimulation in BMDCs using two independent combinations of shRNAs (Plk2/4-1, Plk2/4-2). Three replicates for each experiment; error bars are the SEM.
(D and E) BI 2536 specifically abrogates transcription of antiviral genes without affecting inflammatory genes following stimulation with LPS, poly(I:C), or Pam3CSK4. Shown are mRNA levels (qPCR; relative to t = 0) for 12 indicated antiviral (D) and 12 inflammatory (E) genes in BMDCs treated with BI 2536 (1 μM; dark color bars) or DMSO vehicle (light color bars) and stimulated for 0, 2 or 4 h with LPS (dark and light See also Figures S3 and S4 and Table S4.

