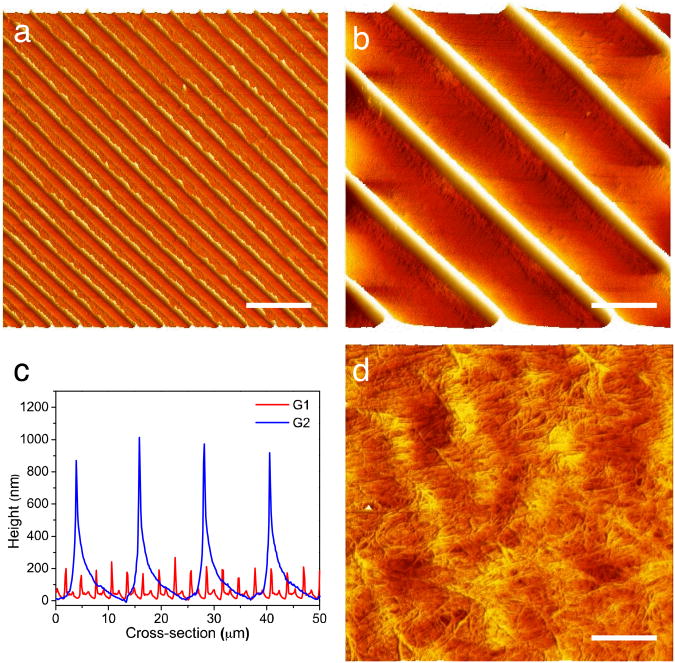
Fig. 2.
AFM imaging of supported chitin substrates (a, b) AFM height images of chitin substrates G1 and G2 respectively (Scale bar: 10 μm), (c) Cross-sectional height profiles of (a) and (b). G1 pitch= 3.0 ± 0.09 μ , height= 193.4 ± 30.4 nm and G2 pitch = 12.2 ± 0.2 μm and height 943.3 ± 62.6, (d) Zoom in of (b) showing chitin nanofiber morphology (scale bar = 200nm).

