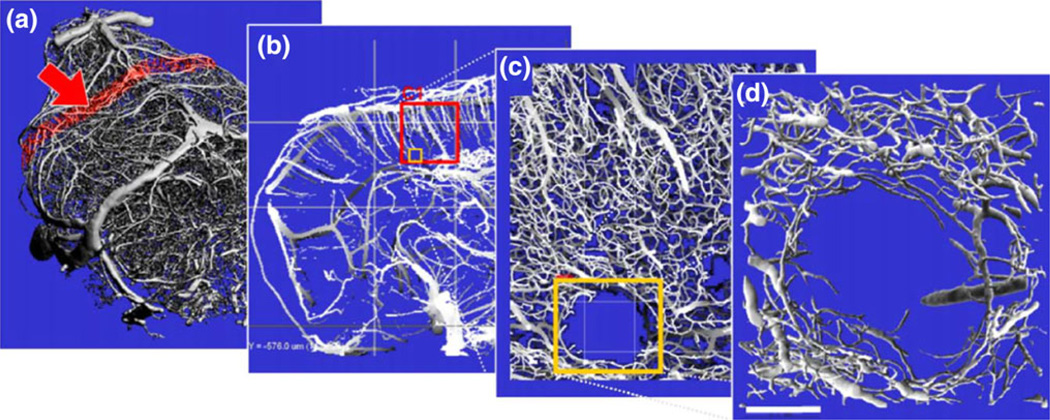
FIGURE 2.
Hierarchical imaging of the mouse brain vasculature. (a) Intact mouse brain vasculature scanned at medium resolution (16 µm voxel size) using a µCT system. (b) Slice of the section marked red in panel (a), revealing the frontal cortex. The red square labeled “C1”denotes a region of interest (ROI) which was measured using SRµCT. (c) Slice of SRµCT high-resolution data visualizing intracerebral arteries and the capillary network. The latter is not visualized in the medium resolution data (b) but provides essential structural characteristics of the vasculature, as for example the microinfarct marked by the red rectangle. (d) Surface rendering of the infarct region marked in panel (c) suitable for detailed 3-D analysis. Scale bar: 100 µm. (Adapted with kind permission from Heinzer et al.47).

