
Fig S6.
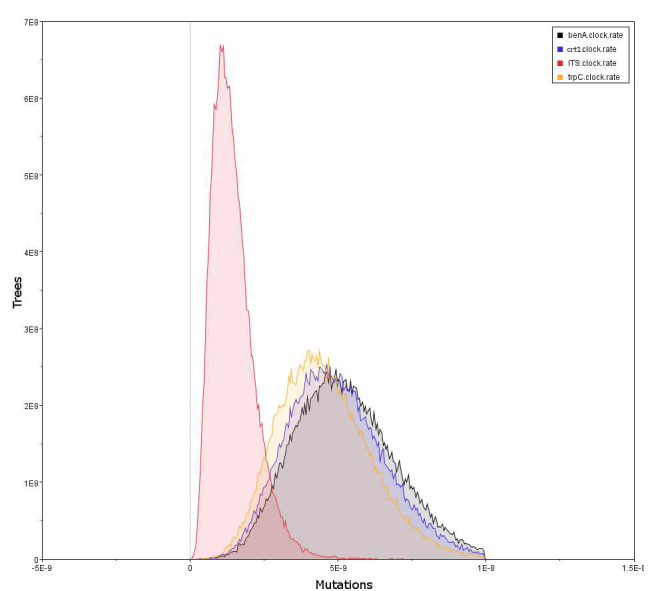
Mutation rates of MLST loci. Generated using Tracer v1.5, this histogram shows the distribution of different mutation rates present in the four loci used for *BEAST analysis. The non-functional ITS locus demonstrated slow mutation as it is highly conserved as a spacer for rRNA. This ITS mutation rate corresponds to the findings of Kasuga et al. 2002.