. 2013 Apr 15;2(Spec Iss):S0001. doi: 10.5702/massspectrometry.S0001

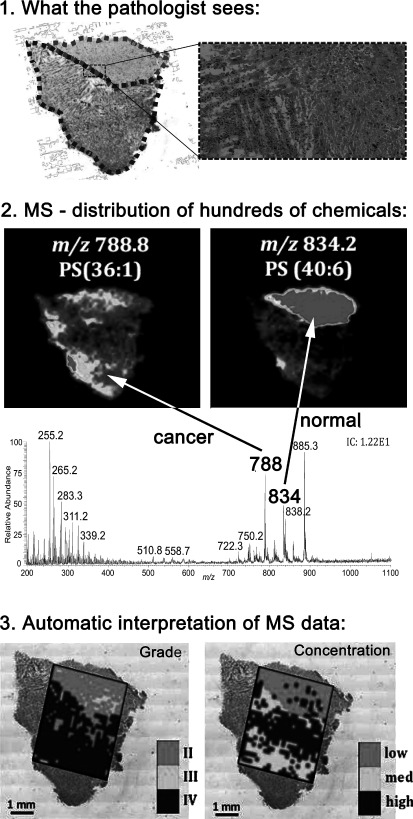
Fig. 3. Classifying human brain tumors by lipid imaging with mass spectrometry. Top: What the pathologist sees: Optical image of the H&E-stained adjacent section. Center: MS-distribution of hundreds of chemicals: Tumor heterogeneity and infiltration is assessed by DESI-MS imaging. Negative ion mode DESI-MS ion images of glioblastoma G33 showing the distribution of PS(36 : 1) at m/z 788 and PS(40 : 6) at m/z 834. Bottom: Classification results can be visualized as a class image using a color code corresponding to each class and registered to the optical image of an adjacent section. Grade and concentration classification for heterogeneous sample G33. Adapted from ref. 59 with permission. © 2012 American Association for Cancer Research.

Fig. 3. Classifying human brain tumors by lipid imaging with mass spectrometry. Top: What the pathologist sees: Optical image of the H&E-stained adjacent section. Center: MS-distribution of hundreds of chemicals: Tumor heterogeneity and infiltration is assessed by DESI-MS imaging. Negative ion mode DESI-MS ion images of glioblastoma G33 showing the distribution of PS(36 : 1) at m/z 788 and PS(40 : 6) at m/z 834. Bottom: Classification results can be visualized as a class image using a color code corresponding to each class and registered to the optical image of an adjacent section. Grade and concentration classification for heterogeneous sample G33. Adapted from ref. 59 with permission. © 2012 American Association for Cancer Research.