. 2013 Apr 15;2(Spec Iss):S0001. doi: 10.5702/massspectrometry.S0001

Fig. 4. Top: General reaction scheme depicting the reductive amination reaction. Bottom left: Reaction control of the reductive amination reaction using inductive nano ESI: Reagent, 1, the intermediate 3 and the final product 4, are each readily measured over a long reaction time period. Bottom right: Scheme of an induced nanoESI emitter. The electrospray potential (2–4 kV) is applied to an electrode approaching the spray emitter within 2 mm. The applied potential is pulsed repeatedly in the positive mode at a frequency of typically 50 Hz. Strong dynamic electromagnetic fields are produced in the adjacent nESI emitter to result in a burst of nESI droplets.62).
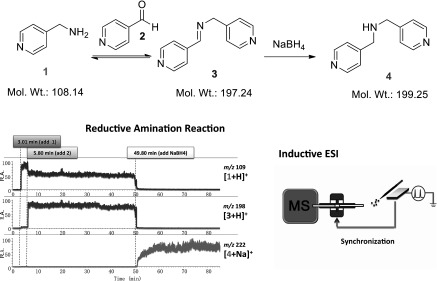
Fig. 4. Top: General reaction scheme depicting the reductive amination reaction. Bottom left: Reaction control of the reductive amination reaction using inductive nano ESI: Reagent, 1, the intermediate 3 and the final product 4, are each readily measured over a long reaction time period. Bottom right: Scheme of an induced nanoESI emitter. The electrospray potential (2–4 kV) is applied to an electrode approaching the spray emitter within 2 mm. The applied potential is pulsed repeatedly in the positive mode at a frequency of typically 50 Hz. Strong dynamic electromagnetic fields are produced in the adjacent nESI emitter to result in a burst of nESI droplets.62)