
Figure 4.
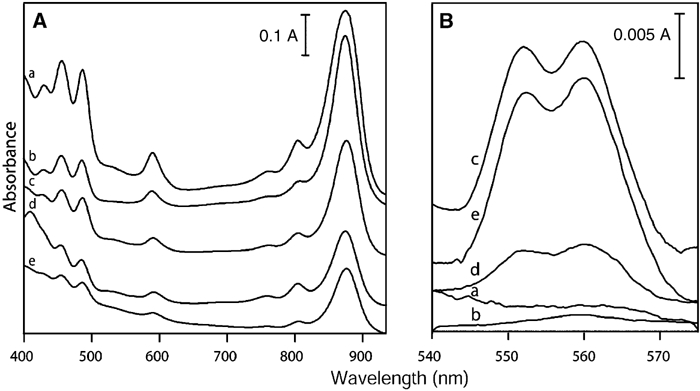
Absorbance spectra of membrane fractions. (A) Absorbance spectra normalised to equivalent total protein concentration. (B) Difference spectra of reduced minus oxidised samples, normalised to equivalent sample absorbance at 875 nm. (a) Purified PufX+ tubes; (b) purified PufX− sheets; (c) band 1 of first PufX+ centrifugation; (d) upper band of second PufX+ centrifugation step; (e) band 2 of first PufX+ centrifugation.