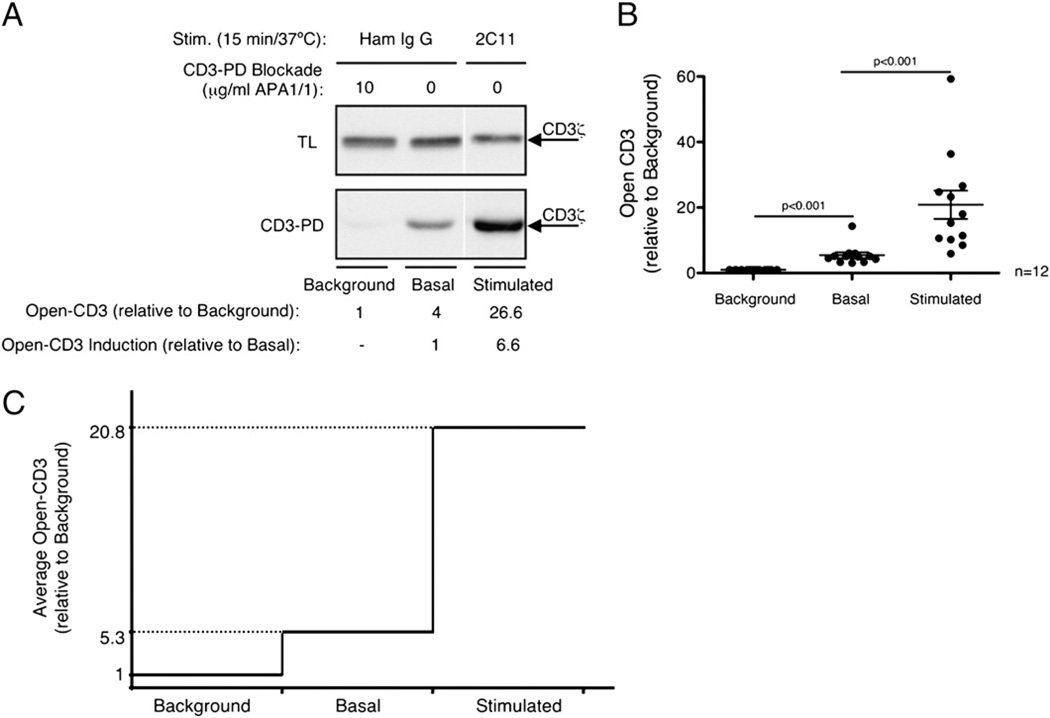
FIGURE 2.
Nonstimulated B6 thymocytes express basal levels of open-CD3. B6 thymocytes were treated in vitro with either Ham IgG (basal condition) or anti-CD3ε mAb 2C11 (stimulated condition). Then samples were subjected to the CD3-PD assay either in the presence or the absence of the blocking mAb APA1/1 to compare the assay background with specific basal and stimulated open-CD3. A, One representative experiment illustrating the amount of open-CD3 in background, basal, and 2C11-stimulated conditions. The fold-increases are shown relative to either background or basal open-CD3. B, Values of open-CD3 found in basal and stimulated conditions are plotted relative to the CD3-PD assay background in 12 independent experiments. Lines represent the mean open-CD3 found in each condition; SE bars for each condition are shown. Paired t tests were run to calculate p values; basal open-CD3 is statistically different from background, and stimulated open-CD3 is statistically different from basal. C, Mean of basal and stimulated amounts of open-CD3 established in these 12 independent experiments relative to CD3-PD assay background are depicted.

