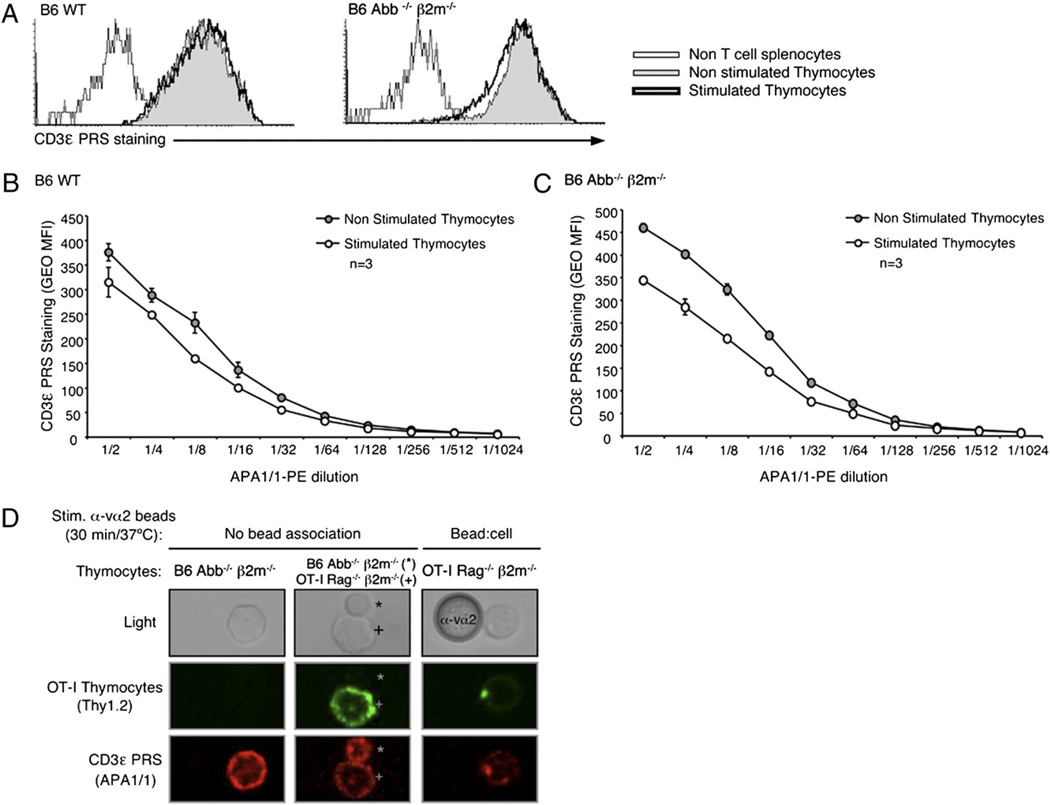
FIGURE 4.
The mAb APA1/1 can bind to the CD3ε cytoplasmic tail independently of TCR–CD3 engagement. Flow cytometry via intracellular staining of the CD3ε PRS using the mAb APA1/1 was performed in parallel to the CD3-PD assay in all nonstimulated and stimulated samples shown in Fig. 3. Splenocytes from B6 Abb−/− β2m−/− mice were added to the samples right after the stimulation, and before the fixation/permeabilization protocol, to provide a non-T cell population and establish the background of this staining. A, Data are from the same experiment shown in Fig. 3A. Histograms are displayed overlaying the CD3ε PRS staining (with 1:2 dilution of APA1/1–PE) of thymocytes treated with either Ham IgG (basal condition) or anti-CD3 mAb 2C11 (stimulated condition) for 15 min at 37°C. B and C, CD3ε PRS stain in B6 WT (B) or Abb−/− β2m−/− (C) thymocytes with decreasing doses of APA1/1–PE is displayed for data from the same experiment shown in Fig. 3A. D, OT-I Rag2−/− β2m−/− thymocytes were labeled in the cold with anti-Thy1.2-biotin plus streptavidin–AF-488, mixed with anti-Vα2 polystyrene latex beads (1:4 ratio), stimulated 30 min at 37°C, and treated with Cytofix/Cytoperm buffer. Samples were then mixed with B6 Abb−/− β2m−/− nonstimulated thymocytes that had been fixed and permeabilized in parallel. The resulting samples were then stained intracellularly with APA1/1–AF-555 and mounted on coverslips for confocal analysis. Micrographs display images at ~×60 magnification, and the anti-Va2 bead is 5 µm in diameter.

