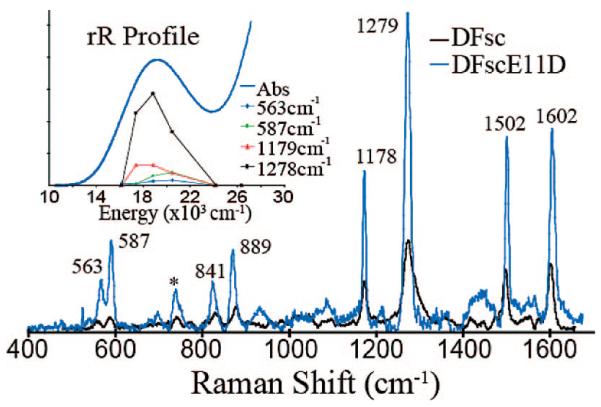
Figure 2.
Resonance Raman spectra of O2 reacted DFsc (black) and DFsc-E11D (blue). Spectra were obtained with 530 nm laser excitation and the specifics of experiment are in Supporting Information. Inset shows enhancement profiles for DFscE11D of the labeled features as a function of excitation energy.

