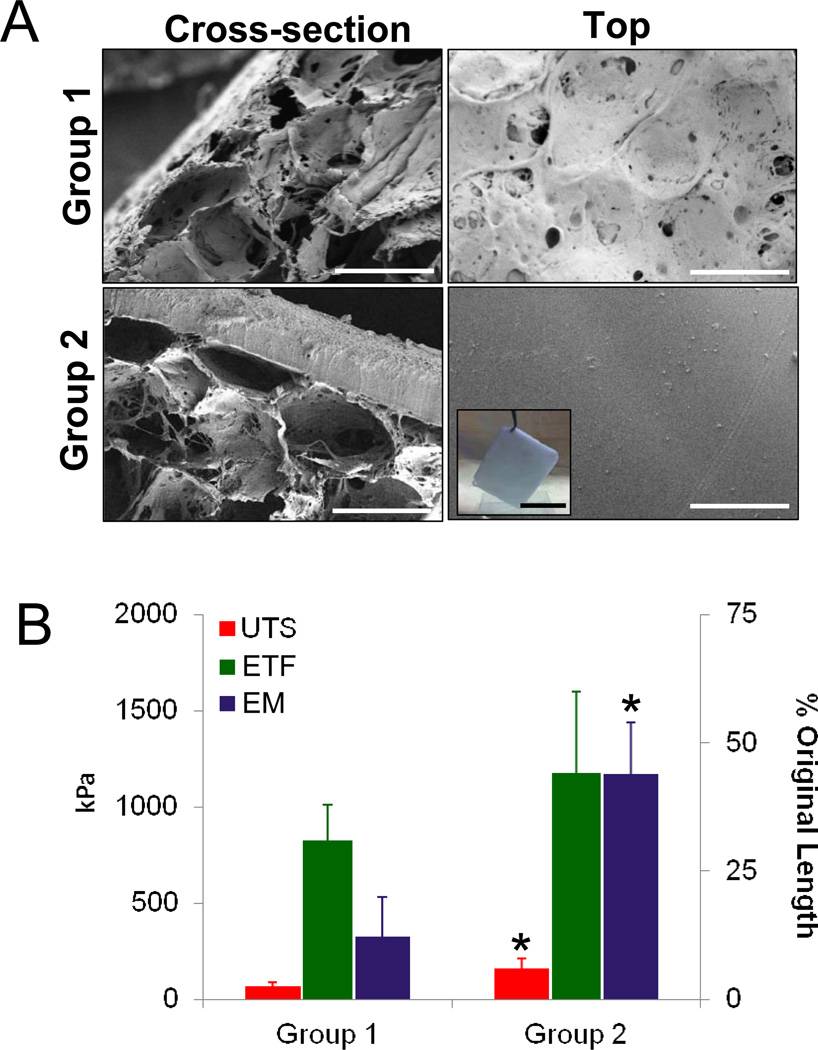
Figure 1.
Structural and mechanical analyses of scaffold groups. [A] Photomicrographs of representative SEM images demonstrating cross-sectional and top views of matrix configurations. Scale bar = 400 µm. Inset: gross view of Group 2 scaffold prior to implantation. Scale bar = 4 cm. [B] Evaluation of ultimate tensile strength (UTS), elastic modulus (EM), and % elongation to failure (ETF) in matrix groups defined in [A]. Means ± standard deviation per data point. (*) = p<0.05 in comparison to Group 1.

