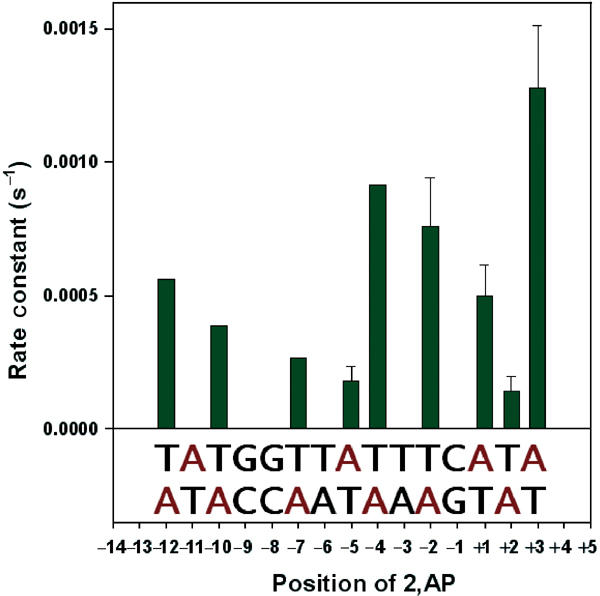
Figure 6.

Rate constants of basepair openings at different positions of galP1 upon RNA polymerase binding as measured by 2,AP fluorescence increase shown in bar graphs. The DNA sequence of the −14 to +5 region of the promoter is shown at the bottom of the bar graphs. The positions of the adenines, which were individually probed by 2,AP in either strand, are shown in red. Error bars are not given for cases in which experiments are carried out only two to three times. Only averages are shown for them.
