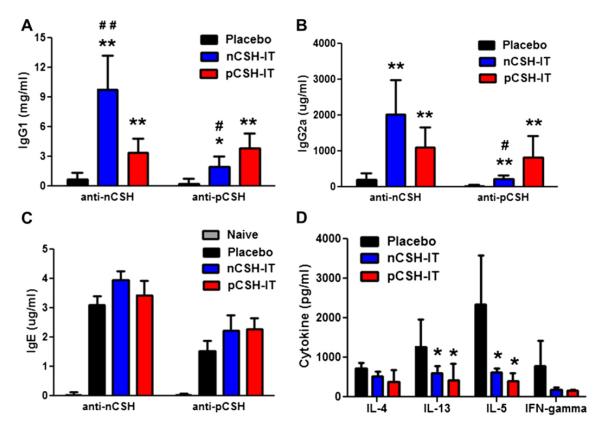
FIG 6.
Humoral and cellular profiles after immunotherapy (IT) in orally sensitized mice. Mice sensitized orally with nCSH were given nCSH, pCSH, or placebo immunotherapy. Serum levels of anti-nCSH and anti-pCSH IgG1 (A), IgG2a (B), and IgE (C) after immunotherapy are shown. Cytokines secreted from splenocytes of the immunotherapy groups are also shown (D). Bars represent means with SDs. *P < .05 versus placebo, **P < .01 versus placebo, #P < .05 versus pCSH immunotherapy, and ##P < .01 versus pCSH immunotherapy. Data shown are representative of 2 experiments and include 5 mice per group.

