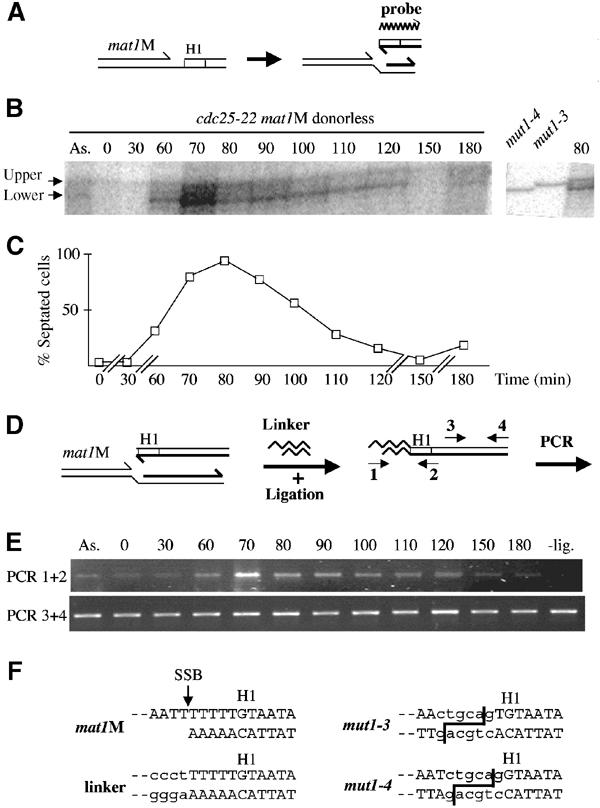
Figure 6.

Mapping of the stalled leading-strand 3′ end at mat1. (A) Schematic representation of the stalled leading strand at mat1 and polarity of the probe. (B) Autoradiogram of purified genomic DNA from a cdc25-22 mat1M donorless synchronized cell culture, digested with SspI and analyzed on a genomic sequencing gel. Left panel: Kinetics of the stalled leading strand. ‘As.' represents the asynchronous cell population and the time (min) after release from the temperature block is indicated. The transitory band is labeled as ‘lower' and the constant band as ‘upper'. This upper band is due to low contamination of the labeled probe by the template used in the labeling reaction (data not shown). Right panel: Migration of the mat1M-distal lower strand of mut1-3 and mut1-4 digested by SspI and PstI, together with the 80 min time point. The position of the PstI sites are shown in (F), right panel. (C) Cell cycle progression was followed by measuring the proportion of septated cells (and cell density, not shown) as a function of time for almost two generations. Time is indicated in minutes (min). (D) Schematic representation of the LM-PCR method. Two pairs of primers were used: (1–2) and (3–4). (E) PCR products using primers (1–2) or (3–4) were amplified for 32 or 26 cycles, respectively, and analyzed on agarose gels. The time is indicated in minutes after temperature block and release. A ‘- lig' control experiment was also performed using the 70-min time point in the absence of ligase. (F) Sequence of the SSB in a mat1M donorless strain. The left panel shows the identical sequence obtained from eight independent clones of the LM-PCR products (using primers 1–2). An arrow indicates the position of the SSB and the linker sequence is written in lower-case letters. Right panel: PstI sequences are indicated in lower-case letters and the cleavage sites are shown for mut1-3 and mut1-4 mutations.
